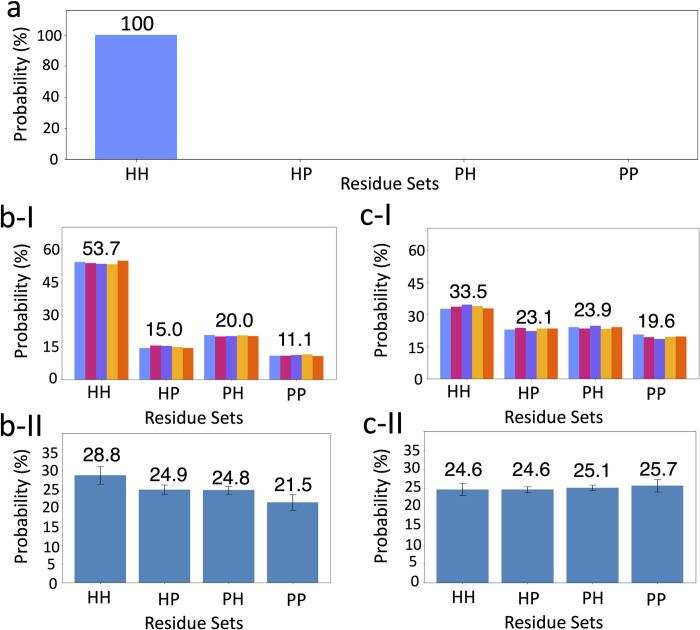
Fig 7. Histogram representations of probabilities for each state in the IBM-SP model circuit.
a) Results of the circuit, using the ideal MPS quantum computer simulator. b) Results of the circuit using: I) gate fidelity, measurement fidelity, initialization fidelity and qubit mapping of ibmq_toronto in the simulator; II) Real ibm_toronto device averaged over 20 different runs. c) Results of the circuit using: I) gate fidelity, measurement fidelity, initialization fidelity and qubit mapping of ibmq_montreal in the simulator; II) Real ibm_montreal device averaged over 30 different runs. In b) and c), the data bars with different colours show results for five separate runs. The error bars represent the standard deviation from the mean value. The numbers on each set of bars show the average probability of the state. The number of samplings for all plots is set to 8,192 shots.

