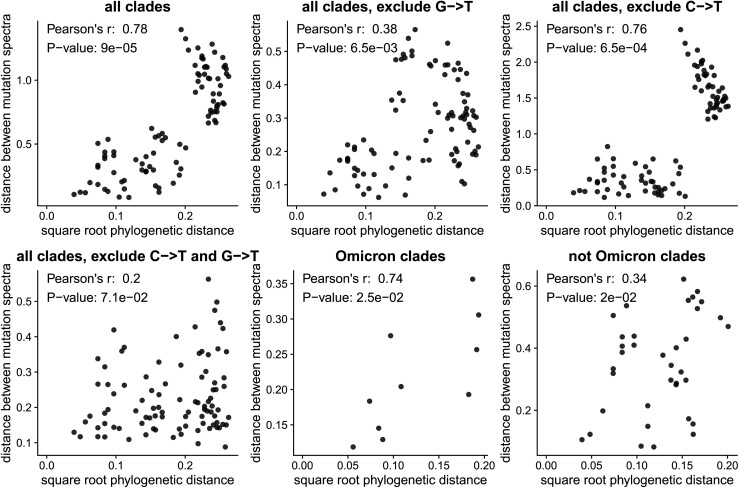
Fig. 2.
The changes in relative mutation rates correlate with the phylogenetic relationships among clades. The plots show the correlation between the square root of the phylogenetic distance separating each pair of clades and the Euclidean distance between the relative mutation rates for those clades. Assuming that mutation rates evolve neutrally according to a Brownian motion model, mutation rate distances should scale linearly with the square root of phylogenetic distance. The P-values are computed using the Mantel test with 100,000 permutations. The plots show that the mutation rates are significantly correlated (P < 0.05) with phylogenetic distance even if we exclude G→T or C→T mutations individually (although not together) or do the analysis only among Omicron or non-Omicron clades.

