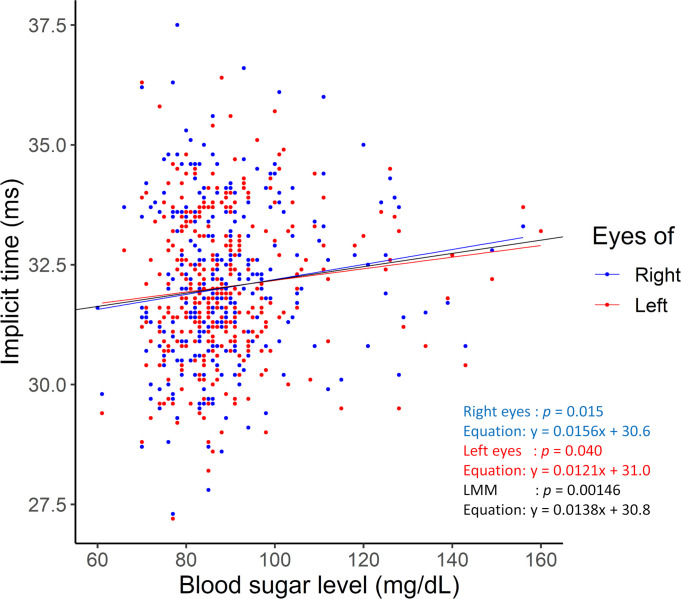
Fig 2. Relationship between blood sugar level and implicit times of the fundamental components of the RETeval flicker ERGs.
The blood sugar levels are plotted against the implicit times of the fundamental component of the RETeval flicker ERGs. In the univariable linear regression analysis between the blood sugar level and implicit times of the fundamental components of the RETeval flicker ERGs, the p = 0.015 in the right eyes (blue plot and approximate line: y = 0.0156x + 30.6), p = 0.040 in the left eyes (red plot and approximate line: y = 0.0121x + 31.0), and p = 0.00146 in the linear mixed effects model (black approximate line: y = 0.0138x + 30.8). LMM, linear mixed effects model.

