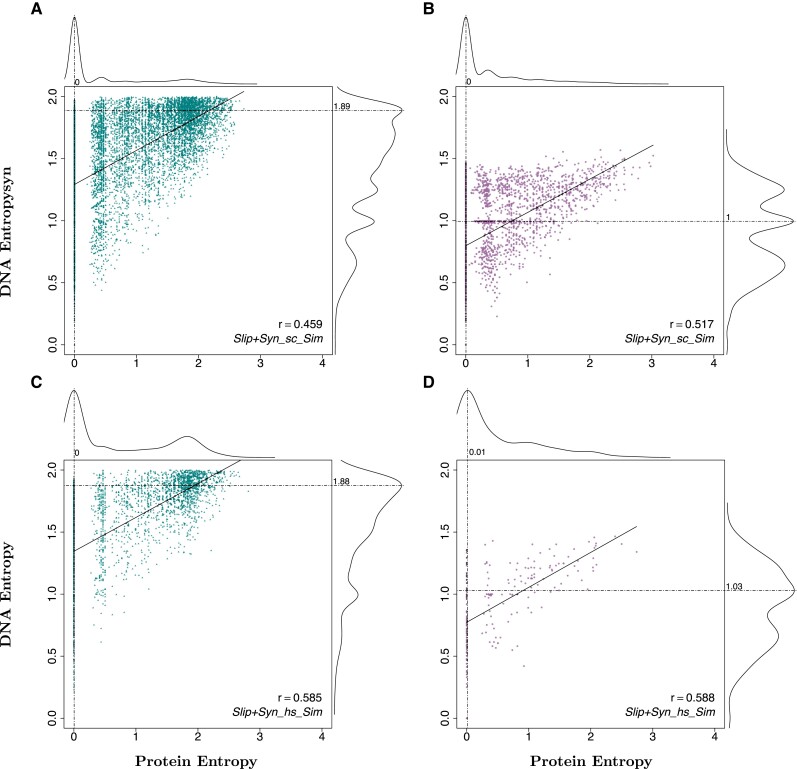
Fig. 6.
Entropy of LCRs from the Slip+Syn simulated proteomes specific to S. cerevisiae and H. sapiens. Distributions of sequence entropies can be found along the vertical and horizontal axes with values indicating the mode. LCRs were identified from a sample of 100,000 sequences. (A) 17,239 LCRs were identified from protein sequences in S. cerevisiae and their entropies were plotted against the entropies of their corresponding coding sequences (). (B) 3,315 LCRs were identified from coding sequences in S. cerevisiae and their entropies were plotted against the entropies of their corresponding protein sequences (). (C) 3,765 LCRs were identified from protein sequences in H. sapiens and their entropies were plotted against the entropies of their corresponding coding sequences (). (D) 260 LCRs were identified from coding sequences in H. sapiens and their entropies were plotted against the entropies of their corresponding protein sequences ().

