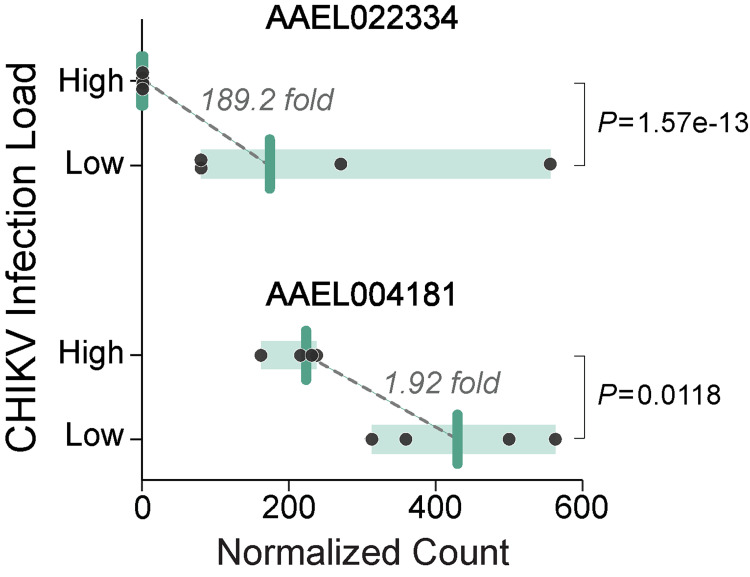
Fig 4. RNAseq counts for the two loci with significant expression differences between high and low CHIKV-load families.
Points depict normalized read counts of individual families, bars show group medians, and shaded area demarcates the range for each group. Significance was evaluated using Wald tests while correcting for multiple comparisons.

