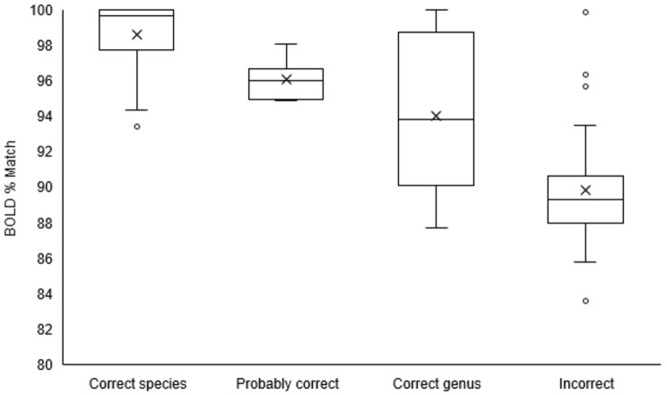
Fig 5. Boxplot of Scarabaeinae case of study showing the range of BOLD percentage matches for the categories: Correctly Identified species, probable correctly identified species, correctly identified genus, and incorrect identification.
The median is represented by a line, the mean is represented by an X markers and outliers are the white dots.

