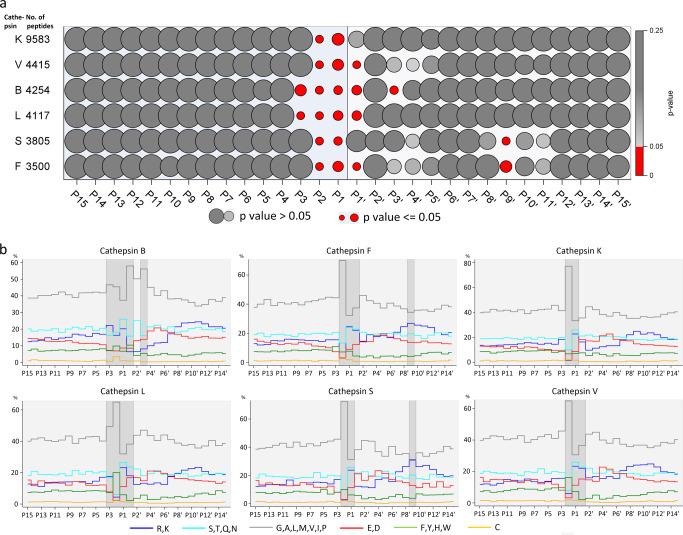
Fig. 2. Heterogeneous positions indicate specificity positions.
a Normality of distributions. P-values for normality of distributions of residues at positions from P15 to P15′ (columns) for each cathepsin (rows) are indicated by the size of circles. The red and grey circles present p-values equal to or less than 0.05 (non-normal), larger than 0.05 and equal to 1.00 (normal), respectively. b Profiles of amino acid residue types. The amino acid residues were classified into 6 groups with share of each presented by a colored step chart: positively charged LYS, ARG (blue), neutral hydrophilic SER, THR, GLN, ASN (cyan), hydrophobic GLY, ALA, LEU, MET, VAL, ILE, PRO (light grey), negatively charged ASP, GLU (red), aromatic PHE, HIS, TYR, TRP (green), and CYS (yellow). The positions in the non-normal distributions of amino acid residues are shaded.

