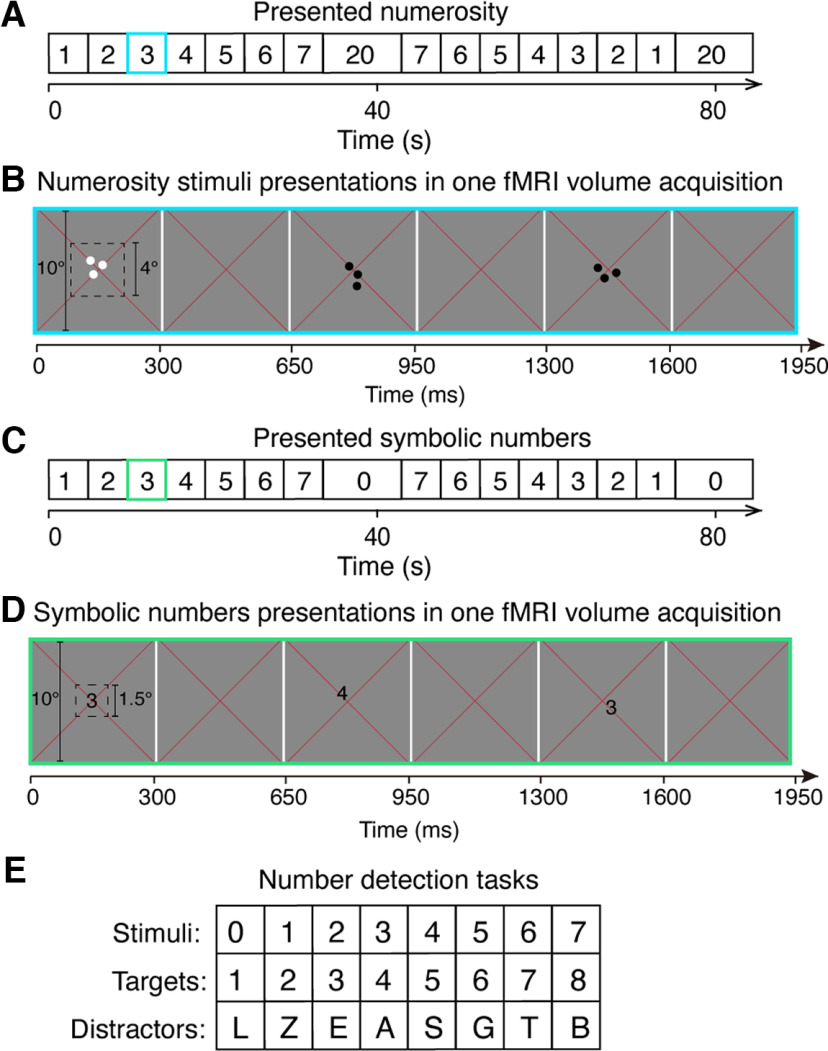
Figure 1.
Illustration of experimental design and stimulus presentations. A, The sequence of the presented nonsymbolic numerosity used to localize the numerosity maps. B, Schematic representation of an example stimulus presentation in the numerosity maps localizer experiment (A, blue frame) within one fMRI volume acquisition (i.e., one TR). Each dot pattern was presented briefly (300 ms) at the central 4° of the visual field, followed by a 350 ms presentation of a gray background before a new random positioned dot pattern presentation. Each pattern of the same numerosity was repeatedly presented 6 times, corresponding to two TRs, before the numerosity changed. Participants fixated the red cross at the center and pressed a button when dots were shown in white rather than black. C, The sequence of presented symbolic numbers. D, Schematic representation of an example trial of symbolic number 3 in the symbolic experiment (C, green frame) within one TR. Each symbol was presented briefly (300 ms) at the central 1.5° of the visual field, with an interstimulus interval of 350 ms of a gray background. Each number was presented 6 times before moving to the next number. Participants fixated at the red cross and responded when the presented number increased in magnitude by 1 compared with the previous presented number. E, Letters, similar in morphology to the target numbers, were used as distractors.

