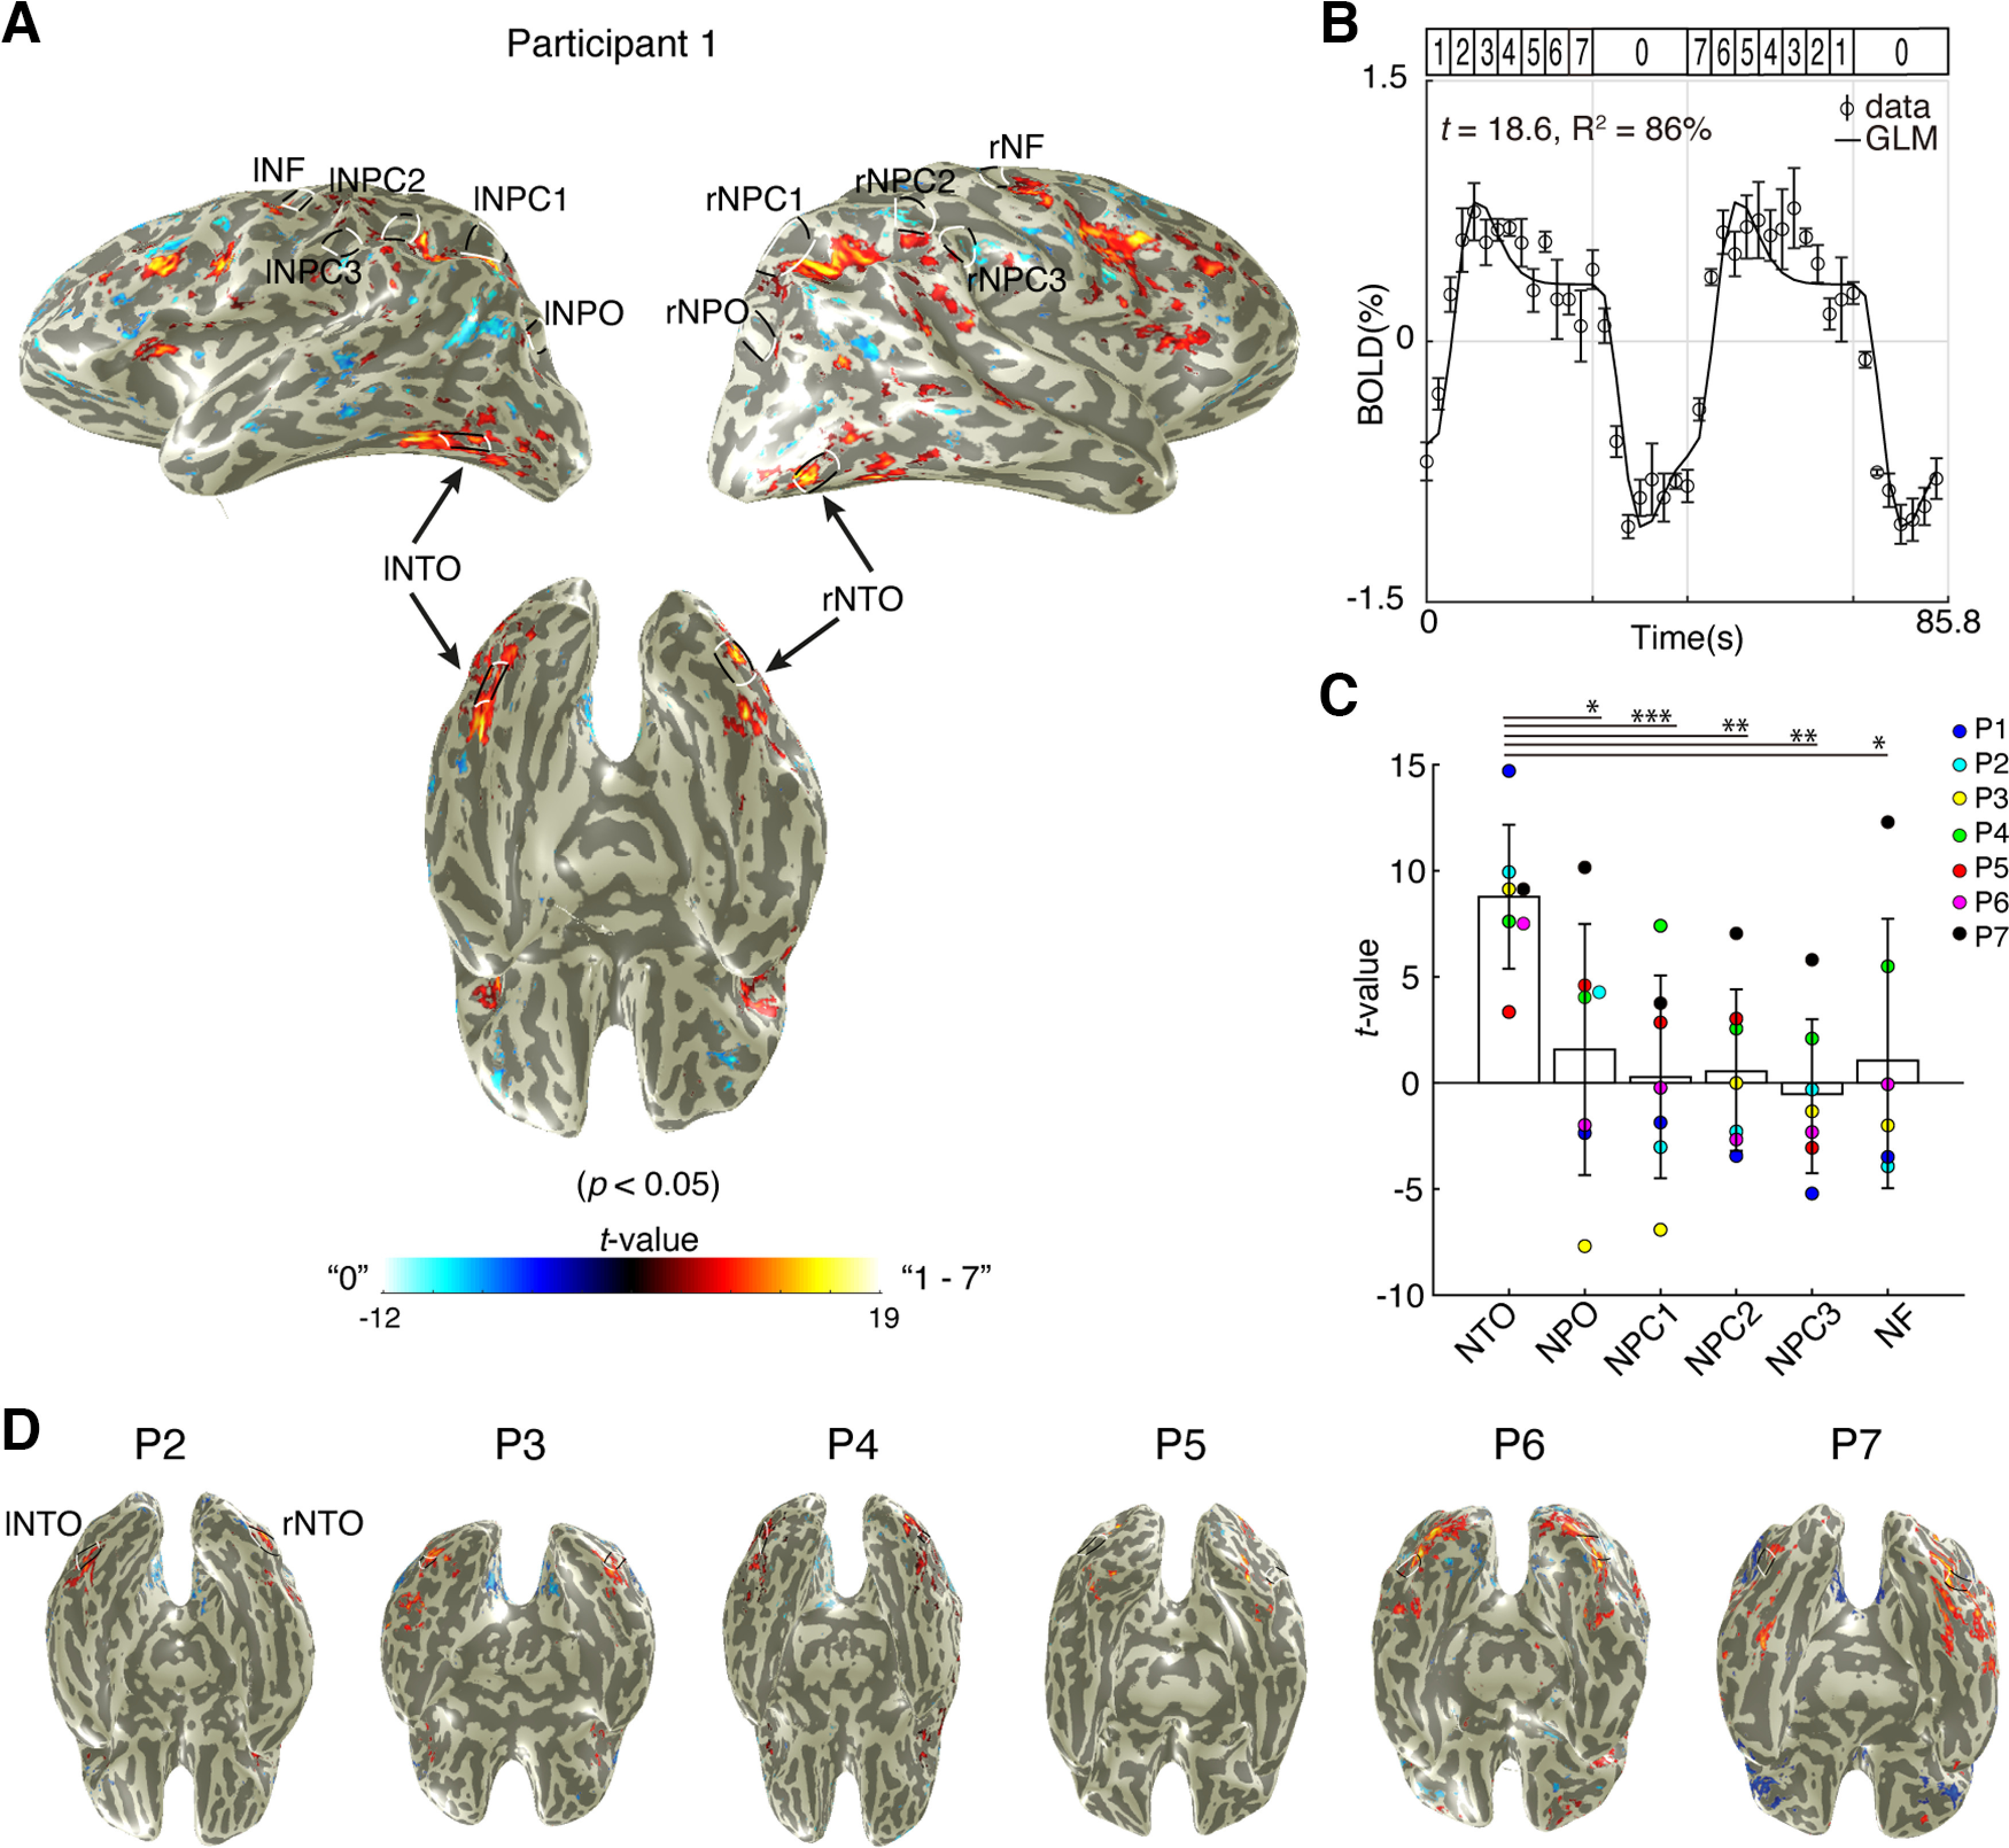
Figure 3.

Stimulus-driven responses to symbolic numbers at numerosity maps. A, The result of an example participant of the GLM analysis, which contrasted the responses to the number of 0 (blue) and 1-7 (yellow-red). Bottom, Ventral view of the cortical surface where the responses to symbolic numbers overlap with the NTO map. Only recording sites (i.e., voxels) with a p value <0.05 (equivalent to the variance explained [R2] by the GLM exceeding 30%) were projected on the cortical surface. B, Response time-series to symbolic numbers at an example recording site extracted from the NTO map. The GLM prediction (solid line) captured 86% of the variance at this recording site with a corresponding t value of 18.6. Dots represent the averaged response amplitude. Error bars indicate SEM over repeated measures. C, Averaged t values at individual maps across hemispheres and participants (n = 41). Repeated two-way ANOVA shows that responses at NTO are significantly higher than responses at the other maps (Bonferroni-corrected for multiple comparisons). Bars represent the mean. Error bars indicate SD of the mean. *p < 0.05. **p < 0.01. ***p < 0.001. D, Ventral view of all other participants. Black and white lines outline the NTO maps.
