Figure 5.
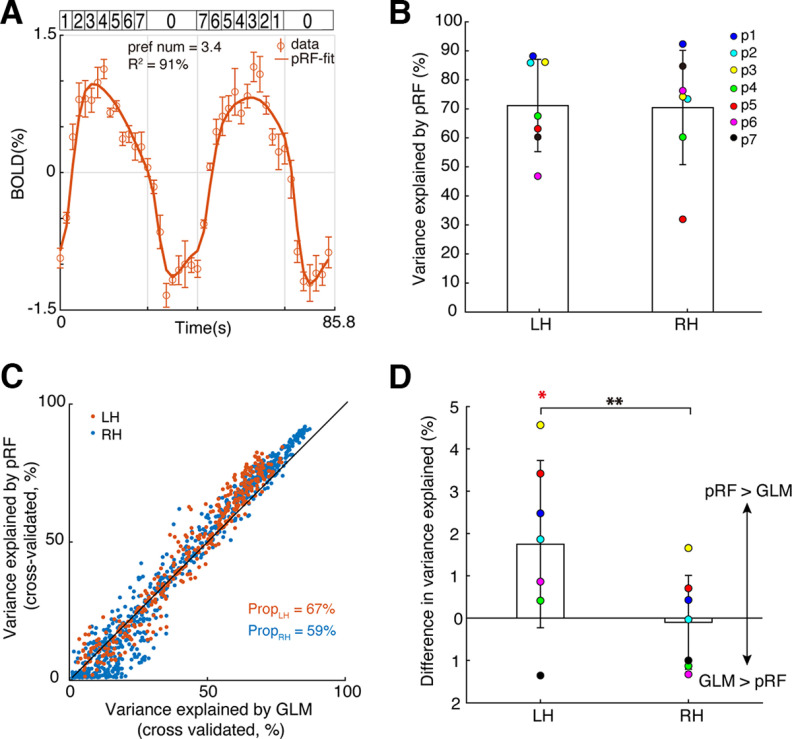
Numerosity-tuned neural populations at the left NTO map are tuned to symbolic numbers. A, Response time-series of an example recording site at the NTO map of Participant 1 and the pRF model prediction. Dots represent the mean response amplitude. Error bars indicate SEM over repeated measures. The best fit neural model (solid line) captured >90% of the variance at this site. B, Averaged variance explained of the pRF models that were fitted to the averaged data (i.e., comprised of 16 runs) of the symbolic number experiment, at bilateral NTO maps across participants (N = 7). C, Cross-validated variance explained of the pRF models and GLM that were fitted to each half dataset (i.e., comprised of 8 runs) at all the recording sites within the NTO map of Participant 1. Black line indicates an equal variance explained by the GLM and pRF model. Texts indicate the proportion of recording sites where the pRF model fit the data better than the GLM. D, Difference in variance explained at bilateral NTO maps derived by pRF and GLMs, averaged across participants. The NTO map in the left hemisphere shows significantly higher variance explained than zero (Wilcoxon's sign rank test, p = 0.0391), and significantly different from the variance explained of the right NTO map (paired t test, p = 0.004). LH, Left hemisphere; RH, right hemisphere. *p < 0.05. **p < 0.01.

