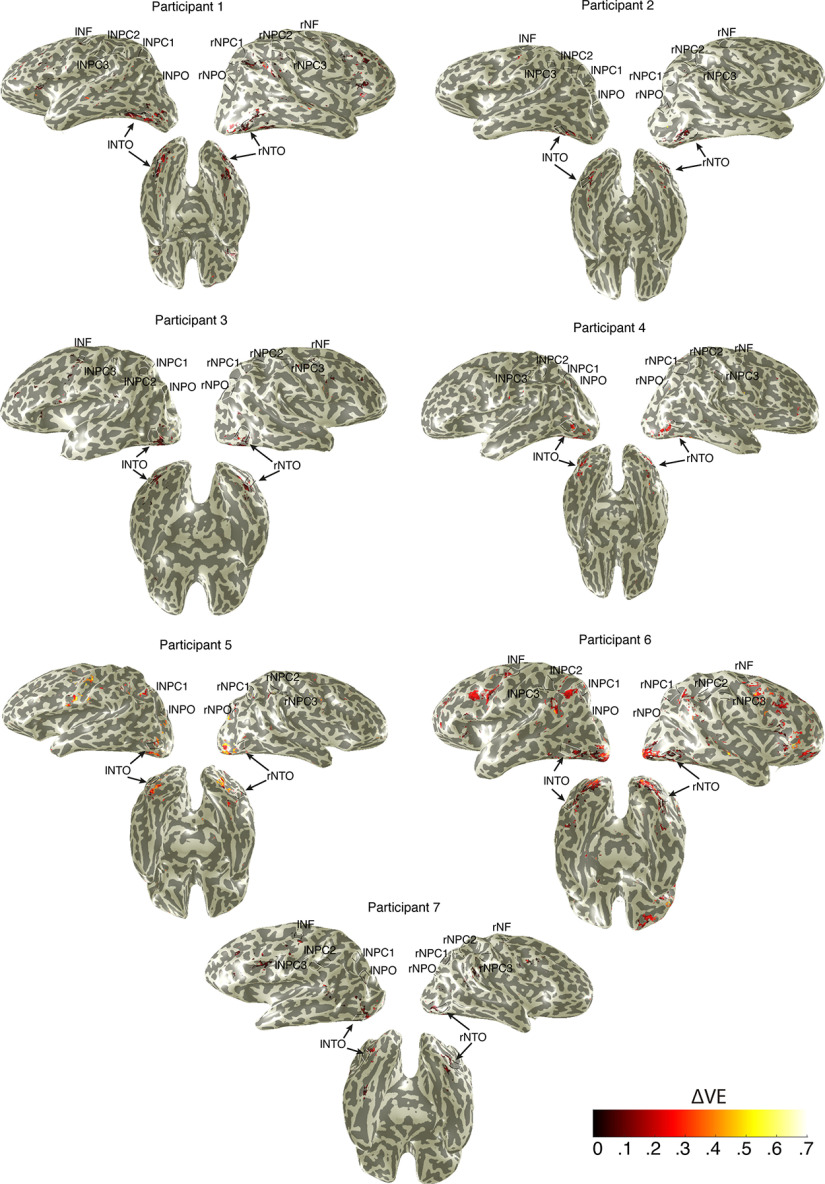
Figure 6.
Subtraction between variance explained by pRF models and GLM highlights that the left NTO maps are also tuned to symbolic numbers. Black lines outline individual numerosity maps. This analysis was performed on those voxels with the variance explained by the pRF models or GLMs exceeding 30%. Only recording sites where the pRF variance explained were higher than the GLM variance explained were projected on the cortical surface.

