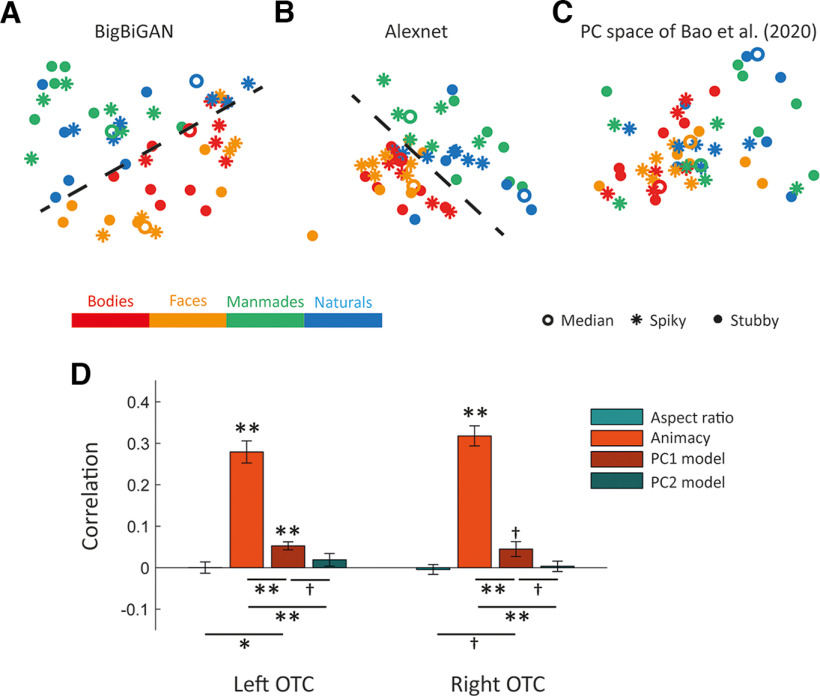
Figure 11.
Two-dimensional representations of our stimuli in different spaces and RSA. Top panels, Points are color-coded based on stimulus category and are dots, rings, or asterisks based on aspect ratio. Dashed line indicates the separation of animate from inanimate. A, The first two PCs computed for the BigBiGAN's latent vectors of our stimulus set. B, The first two PCs computed for the Alexnet-fc6 activation of our stimulus set. C, Our stimuli mapped to the PC space originally defined by Bao et al. (2020). D, Representational similarity and effects of aspect ratio, animacy, and PC1 and PC2 models in the occipitotemporal cortex. Bar plot represents the mean Spearman's correlations between neural RDMs and model RDMs. Error bars indicate SEM. **p < 0.001; *p < 0.01; †p < 0.05; one-sided one-sample or two-sided paired t test.

