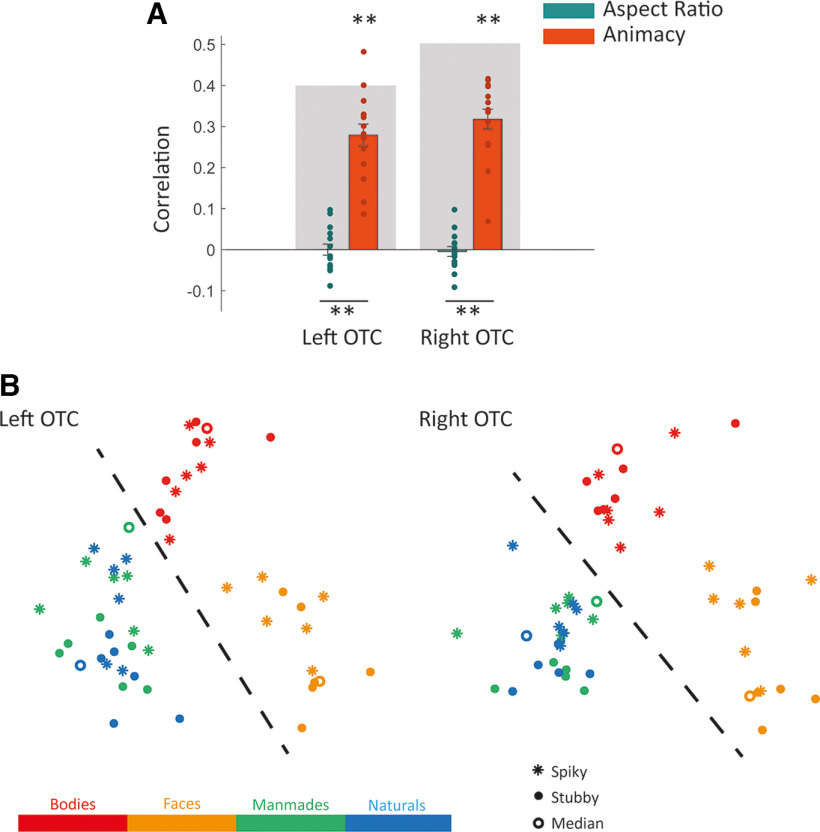
Figure 2.
Representational similarity and effects of aspect ratio and animacy in the occipitotemporal cortex. A, Bar plot represents the mean Spearman's correlations between neural RDMs for individual subjects (dots) and model RDMs. Error bars indicate SEM. Gray background bars represent the noise ceiling. **p < 0.001; *p < 0.01; one-sided one-sample or two-sided paired t test. B, Two-dimensional representational space as obtained by applying MDS to the OTC's neural RDM. Points are color-coded based on stimulus category and are dots, rings, or asterisks based on aspect ratio. Dashed line indicates the separation of animates from inanimates.

