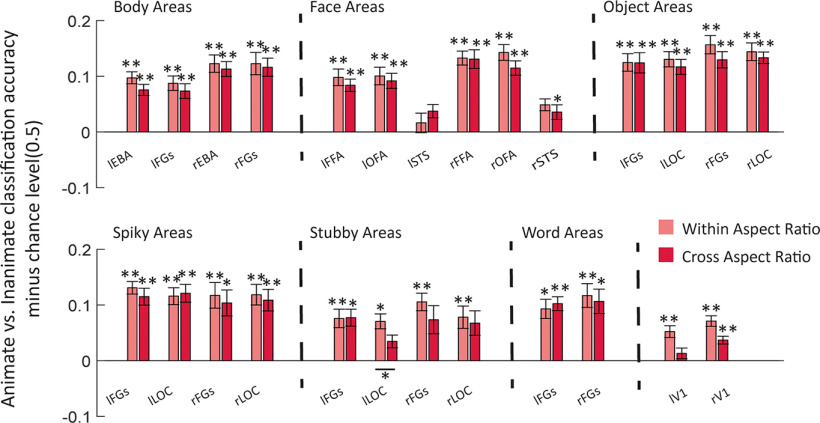
Figure 8.
Animate versus inanimate classification in category-selective ROIs. Bar plot represents the mean classification accuracy minus chance level (0.5) for animate versus inanimate classification when aspect ratio is similar (within) or very different (across) in the training and the test images. Error bars indicate SEM. *p < 0.01; **p < 0.001; one-sided one-sample or two-sided paired t test, FDR-corrected.

