
Figure 6.
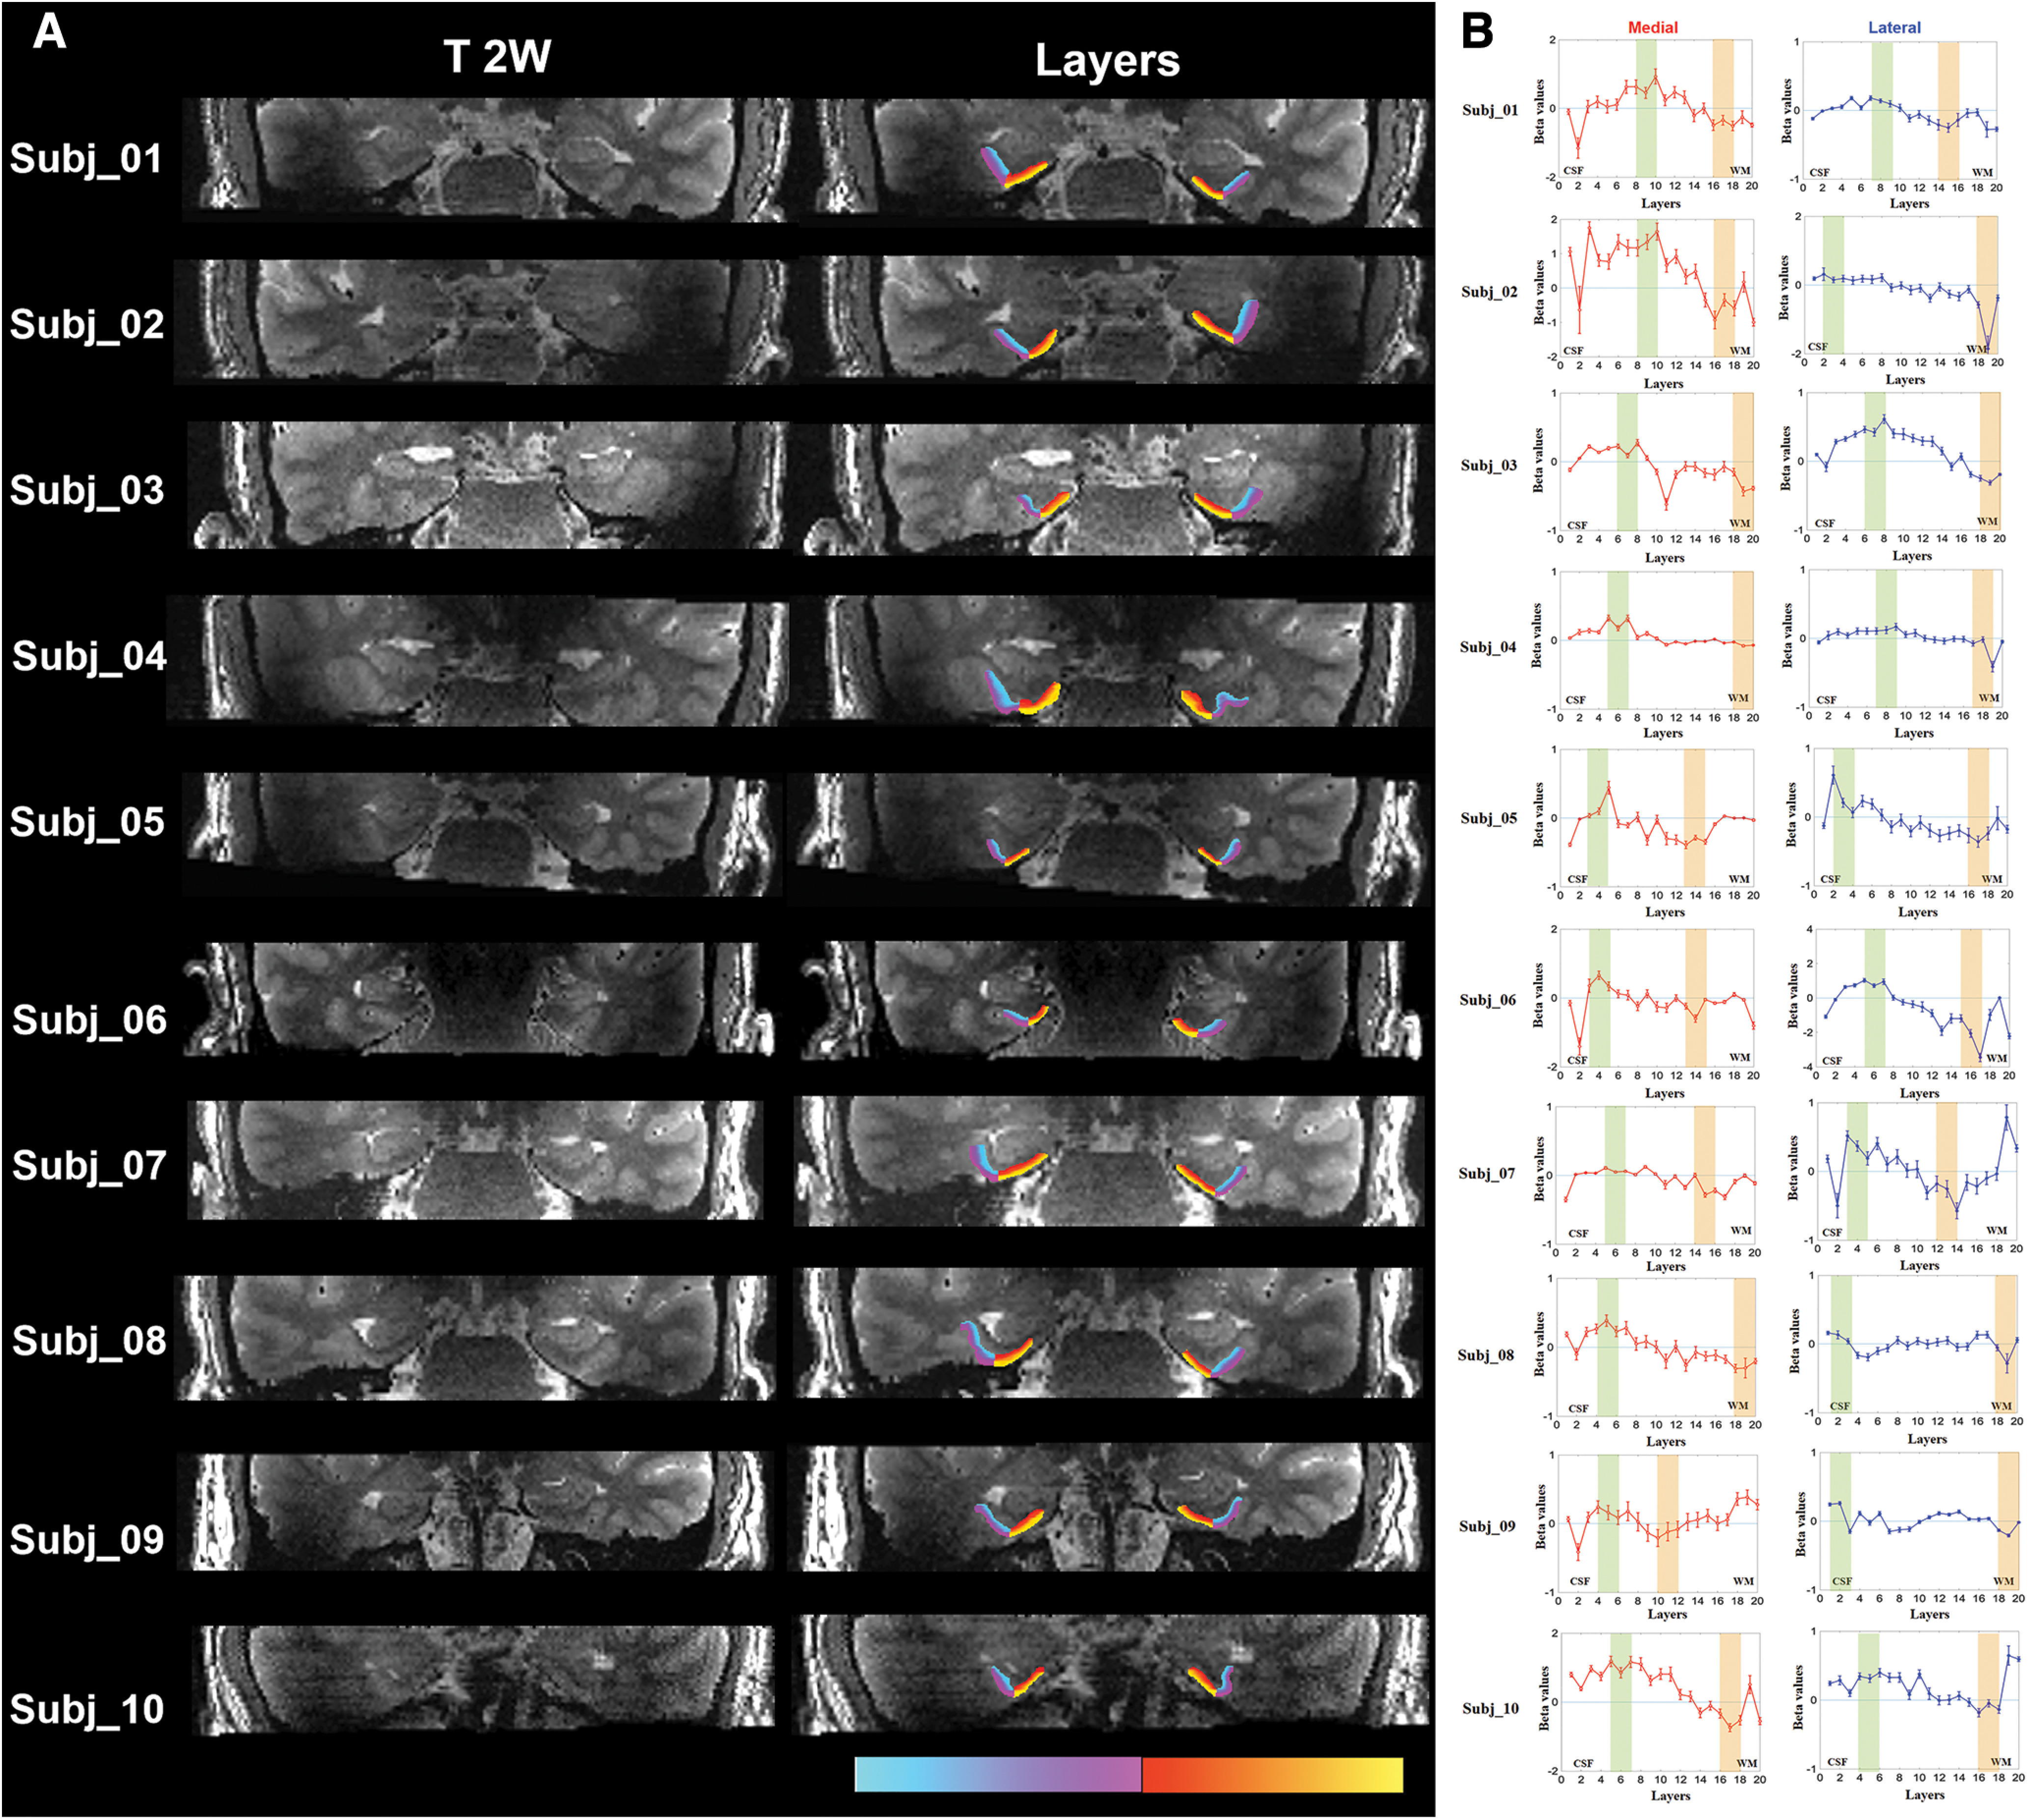
A, Left, Individual high-resolution T2-weighted images from each subject used for layer segmentation. Right, The segmented superficial and deep layers in the lateral and medial entorhinal cortex are overlaid on the T2-weighted images with different colors; purple, superficial lateral; blue, deep lateral; yellow, superficial medial; red, deep medial. B, Individual fMRI results and selection of layers in analysis method 3 with peak layers. The shaded areas indicate the selection of three consecutive layers with the most positive and most negative beta values among the 1st to 10th layers and the 11th to 20th layers for the superficial (green) and deep (orange) layers, respectively. The beta values in the shaded layers were averaged to give mean beta values in the superficial and deep layers, respectively. Error bars indicate the intrasubject SEs. In analysis methods 1 and 2, selection of layers is the same for all subjects (data not shown).