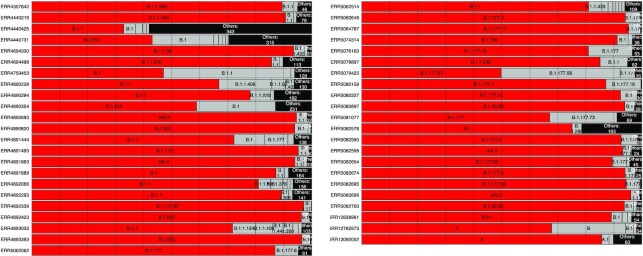
Figure 3.
Visualization of called lineages from Pangolin. Red bars indicate the lineage of the most probable sequence and grey bars represent other sequences called from the same SAM file. Any lineage with fewer than 100 observations in the simulated sequences was grouped into the ‘Other’ category. There were 95 sequences total, but we only plotted the ones where the second most common lineage designation had >250 observations.

