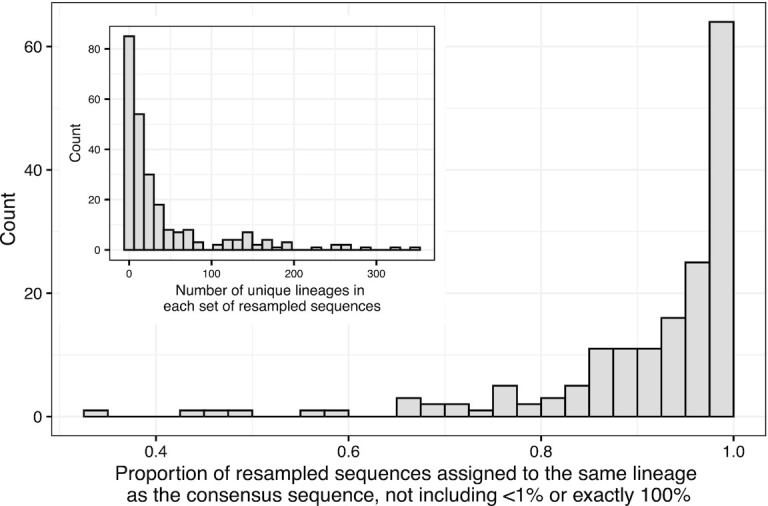
Figure 4.

Main plot: Proportion of resampled sequences that are assigned to the same lineage as the consensus sequence. One proportion is calculated for each SAM file. The sets of resampled sequences where the proportion was <1% or exactly 100% are explained in the section titled Re-sampling the probabilistic sequence. Inset: The number of distinct lineage assignments within each set of resampled sequences.
