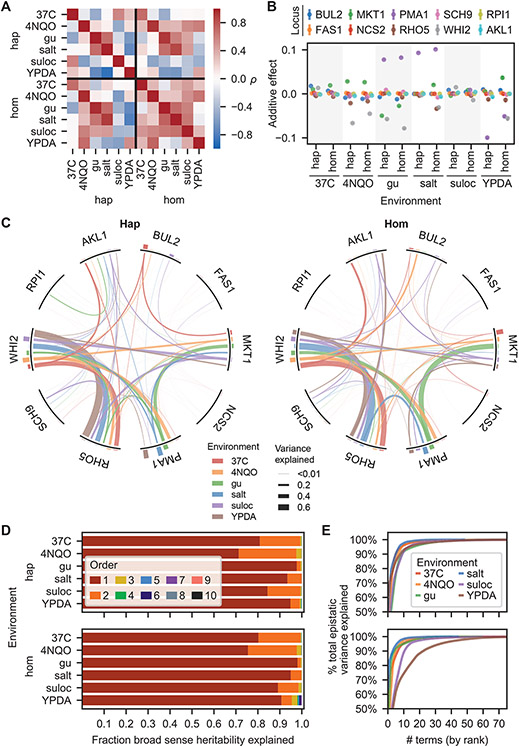
Fig. 2. Fitness landscapes.
(A) Correlation in observed fitness (upper right) and predicted fitness (from inferred model, lower left, see SI section 5.1) across ploidies and environments. (B) Background-averaged additive effect of each locus across ploidies and environments. Error bars represent 95% confidence intervals. (C) Background-averaged pairwise epistatic effects between loci across ploidies and environments. Weights of edges connecting loci represent the proportion of pairwise variance explained by each interaction. Heights of bars on the perimeter correspond to the proportion of additive variance explained by each locus in each environment. (D) Variance partitioning of broad-sense heritability from additive and epistatic orders across ploidies and environments. (E) Cumulative distribution of the epistatic variance explained by rank-ordered epistatic terms of all orders.

