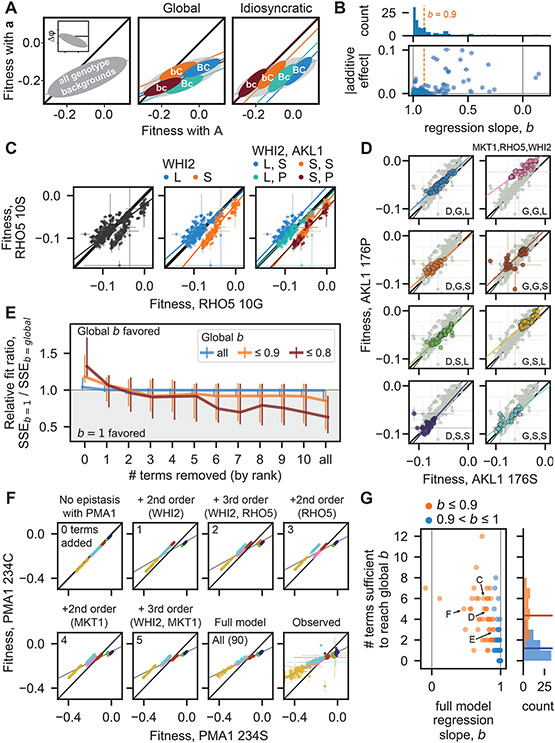
Fig. 3. Fitness-correlated trends (FCTs).
(A) Schematic contrasting how global or idiosyncratic epistasis could produce FCTs. Inset shows FCT analyzed as the effect of a mutation (Δφ) on backgrounds of different fitnesses. (B) Histogram and scatterplot of regression slopes, b, between φMut and φWT, and corresponding absolute additive effects of mutations. Polarity adopted such that b ≤ 1. Total error bar length is twice the standard error of the slope. (C) Fitness effect of RHO5 mutation (G10S) (φMut versus φWT) in all haploid backgrounds at 37°C (left) and partitioned by genotypes at WHI2 (L262S) (middle) and WHI2 and AKL1 (S176P) (right). Initial SSEb=1 / SSEb=global is 1.21. (D) Fitness effect of AKL1 mutation in all homozygote backgrounds in the suloctidil environment, partitioned by genotypes at MKT1 (D30G), RHO5, and WHI2. Initial SSEb=1 / SSEb=global is 1.31. (E) Median relative fit ratio between regressions with fixed slope of b=1 and b=global, as function of number of epistatic terms removed from observed phenotypes. Vertical lines represent interquartile range. Polarity adopted such that b ≤ 1. (F) Inferred fitness effect of PMA1 S234C mutation in 4NQO environment across all haploid backgrounds. Epistatic terms interacting with PMA1 are completely removed from genotype fitnesses, then added back sequentially (from largest to smallest). Bottom-right: full-model (inferred) and observed genotype fitnesses, respectively. Grey line is regression slope. (G) Scatterplot and histograms of FCT regression slopes for all data, and number of epistatic terms sufficient to recapitulate them. Horizontal lines in histogram indicate means. Arrows, letters indicate populations presented in previous panels. Polarity adopted such that b ≤ 1.

