. 2023 Apr 24;12:e83545. doi: 10.7554/eLife.83545

Figure 1. O-propargyl-puromycin (OPP) labeling in Drosophila brain.

(A) Global protein synthesis (35S-met/cys incorporation) is unaltered for 8 hr in newly-isolated w1118 whole brain preparations (ANOVA, n.s. n=4–5 groups of 8–10 brains per timepoint). (B) Schematic illustrating cell type-specific protein synthesis labeling by PGA-dependent OPP incorporation (POPPi) for visualization or capture of the nascent proteome. Spatially targeted penicillin G acylase (PGA) expression catalyzes phenylacetyl-OPP (PhAc-OPP) blocking group removal, liberating OPP for incorporation into nascent polypeptide chains (NPC). OP-puromycylated proteins can be visualized by confocal microscopy following conjugation to a fluorescent-azide or enriched following conjugation to desthiobiotin-azide. (C) Newly-synthesized protein (from w1118 brains) visualized by AF488-azide after OPP incubation but not without OPP (ctrl) and diminished signal with cycloheximide (CHX). Labeling appears stronger in cell bodies within the cell cortex (C) than in the neuropil (n). Higher magnification (63 x) images are from the cell cortex. Scale bars are 60 μM (or 10 μM for 63 x). (D) Quantitation of (C) revealing a significant effect of the treatment group (ANOVA, p<0.0001, Bonferroni post-test, **p<0.01, ****p<0.0001, n=8–11 brains/group). (E) In-gel fluorescence of brain protein extracts, ctrl is no OPP. Data are mean ± SEM. Schematic in B created on Biorender. See also Figure 1—figure supplements 1 and 2.

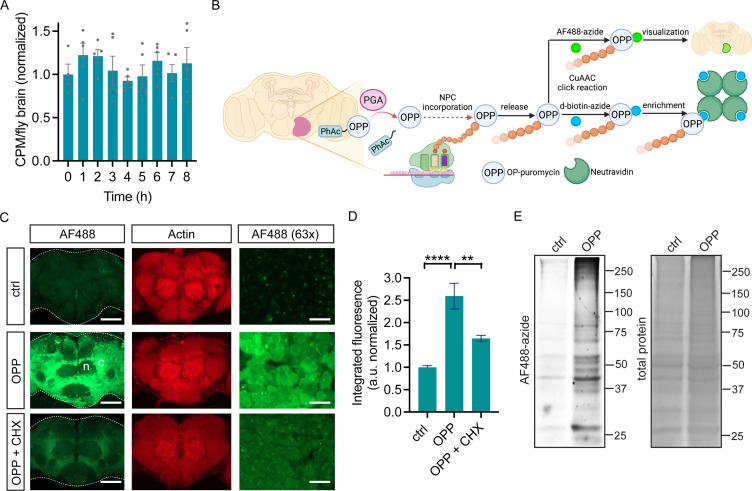
Figure 1—source data 1. Source gel images for Figure 1E.

Figure 1.

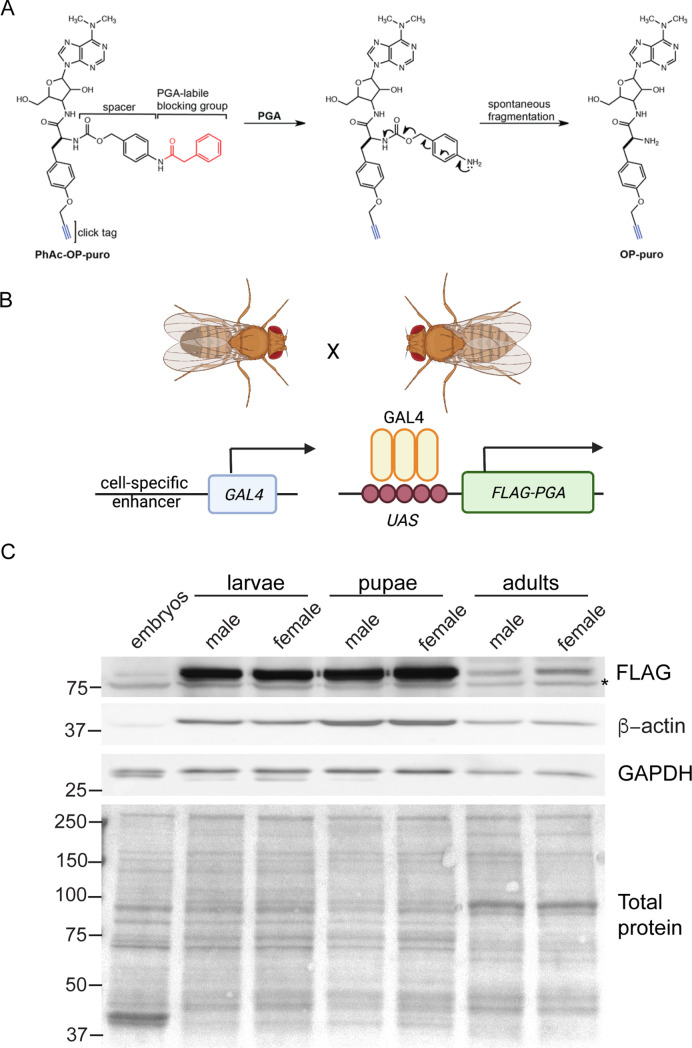
Figure 1—figure supplement 1. Penicillin G acylase (PGA)-dependent conversion of phenylacetyl-OPP (PhAc-OPP) to O-propargyl-puromycin (OPP) in Drosophila.

Figure 1—figure supplement 1.

(A) Scheme illustrating the conversion of PhAc-OPP to OPP by penicillin G acylase (PGA). PGA catalyzes the removal of the phenylacetyl blocking group and the carbamate spacer then undergoes spontaneous fragmentation to generate OPP. (B) Scheme illustrating expression of N-terminally FLAG-tagged PGA under a cell-specific driver of choice using the binary GAL4/UAS system. (C) PGA expression levels within whole embryos or the brains of L3 larvae, pupae or adult flies expressing PGA via the ubiquitous Actin5C-GAL4 driver. Asterisk, non-specific band. Both loading controls (β-actin and GAPDH) are divergent in expression, size, and/or number of bands between embryos, larvae, pupae, and adults, hence a Ponceau stain is shown for protein loading. Illustration in B created on Biorender.
Figure 1—figure supplement 1—source data 1. Source western blots for Figure 1—figure supplement 1C.
© 2016, American Chemical Society
Panel A is reprinted (adapted) with permission from Scheme 1 of Barrett et al., 2016. It is not covered by the CC-BY 4.0 license and further reproduction of this panel would need permission from the copyright holder.

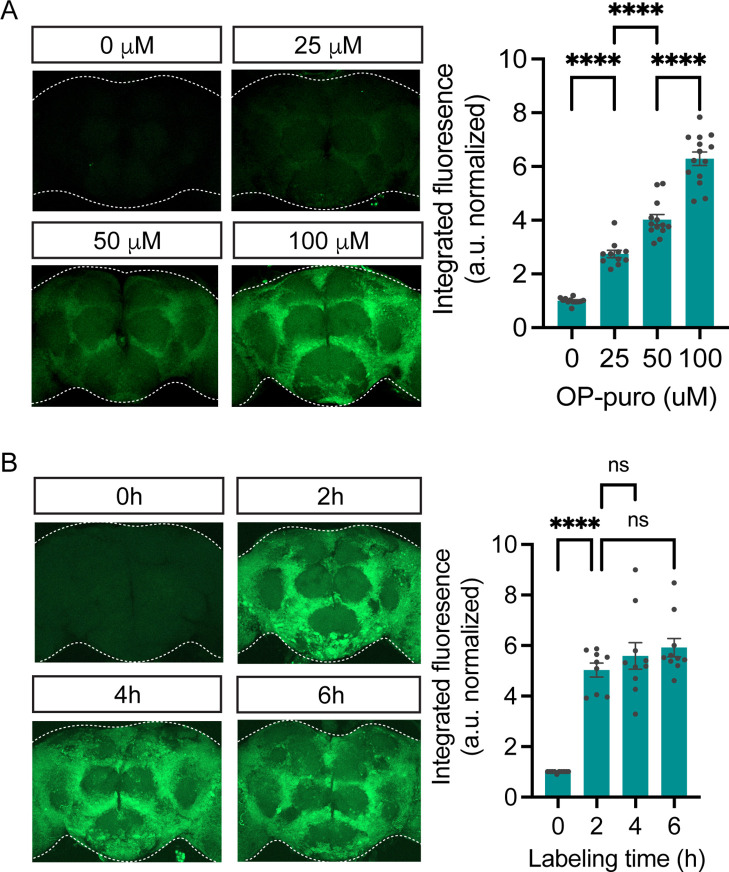
Figure 1—figure supplement 2. O-propargyl-puromycin (OPP) nascent proteome labeling is concentration and time-dependent.

Figure 1—figure supplement 2.

(A) Significant effect of OPP concentration on OPP labeling in standard laboratory control flies (w1118, ANOVA, p<0.0001, Bonferroni post-tests, ****p<0.0001, n=11–14 brains/group). Labeling time was 2 hr. (B) Significant effect of labeling time on OPP labeling in w1118 flies (ANOVA, Bonferroni post-tests, ****p<0.0001, n=9–10 brains/group). 50 μM OPP was used. Data are mean ± SEM.