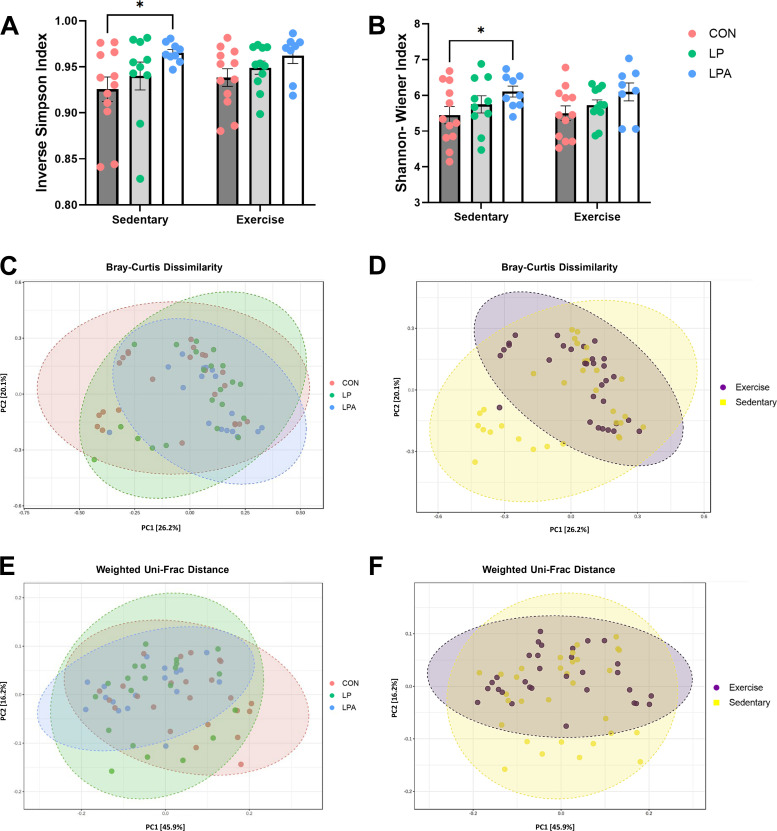
Figure 2.
Fecal microbiome diversity analysis in aged male rats. Diversity within samples was assessed using Inverse Simpson and Shannon–Wiener indexes (A and B). Data were calculated using a mixed model analysis of variance followed by Bonferroni post hoc multiple comparisons correction. Probiotic treatment significantly altered the Inverse Simpson and Shannon–Wiener indexes showing a higher α diversity among probiotic groups. Diversity between samples was calculated using a permutational multivariable analysis of variance on Bray–Curtis dissimilarity and on Weighted Uni-Frac distances and were visually displayed through the principal coordinate analysis (PCoA) using the relative percentage abundance of amplicon sequence variants. The Bray–Curtis dissimilarity distance indicated a significant effect of exercise, but not of probiotic treatment (C and D) whereas the Weighted Uni-Frac distance revealed a main effect of probiotic but not of exercise training (E and F). Data are expressed as group means ± 1 SE; (n = 63 rats). *Statistical significance P ≤ 0.05. CON, Control; LP, L. paracasei; LPA, L. paracasei expressing Angiotensin (1–7).

