Figure 7.
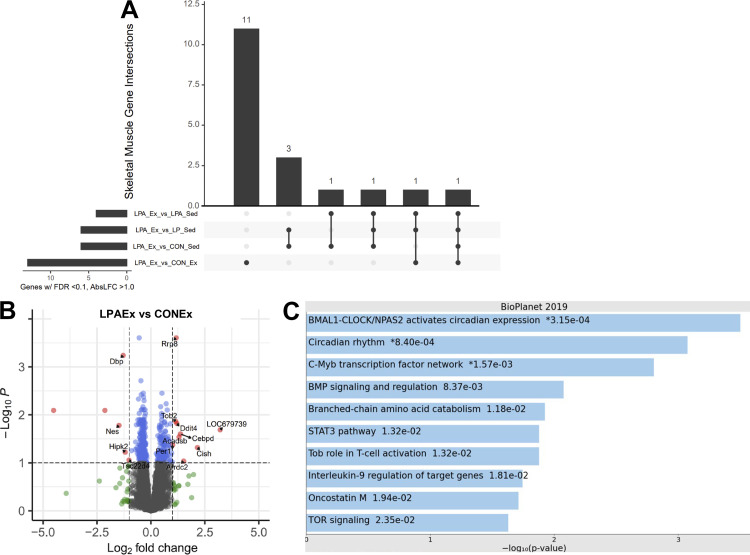
Differential gene expression analysis on tibial anterior skeletal muscle of aged male rats. Differential expressed genes (DEGs) were calculated using DESeq 2 for all groups compared with Lactobacillus paracasei expressing angiotensin (1–7) + exercise group (LPAEx) using false discovery rate (FDR) < 0.10 and log2fold change > 1.0. Upset graph displays the transcriptomics responses on skeletal muscle using LPAEx as the comparator across groups (A). Data showed a small effect of our probiotic treatment. Probiotic treatment altered 15 DEGs in the LPAEx vs. control + exercise group (CONEx) comparison (9 up- and 6 downregulated; B). The enrichment pathway analysis presents the top 10 most significant pathways of the DEGs upregulated in this comparison (C). Follow-up pathway analysis showed that most genes upregulated in the skeletal muscle were associated with circadian rhythm signaling pathways. In the volcano plots, gray dots stand for nonsignificant genes; blue dots present genes that had FDR < 0.10; green dots show genes with log2fold change > 1.0; red dots represent the DEGs with both criteria FDR < 0.10 and log2fold change > 1.0; (n = 4–6 rats).

