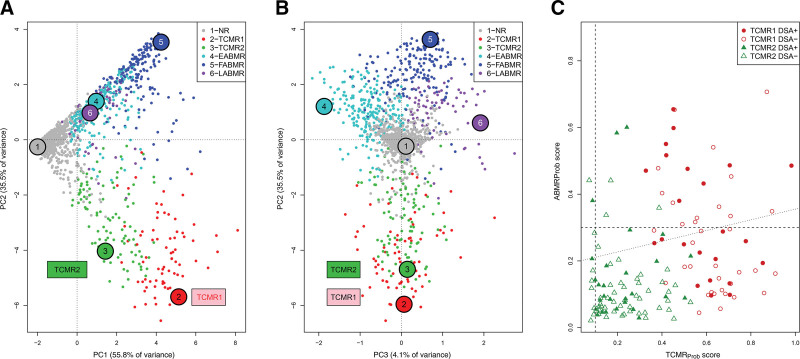
FIGURE 2.
Visualizing TCMR1 and TCMR2 archetypal groups. The 1679 biopsies are shown distributed by their rejection classifiers scores in PCA and colored by their archetype assignment, with y-axis PC2 and x-axis (A) PC1, and (B) PC3. A, TCMR1 and TCMR2 show a gradient across PC1, and TCMR1 is lower than TCMR2 in PC2. B, PC3 separates AMR stages but does not separate TCMR1 and TCMR2. C, TCMR1 and TCMR2 biopsies distributed by their AMR activity (y-axis, AMRProb classifier scores) vs their TCMR activity (x-axis, TCMRProb classifier scores). AMR activity was correlated with TCMR activity (Spearman correlation coefficient = 0.35, P = 1.8E–6). The biopsies from DSA-positive patients are indicated. AMR, antibody-mediated rejection; AMRProb, AMR-probability classifier; EAMR, early-stage molecular AMR; FAMR, fully developed molecular AMR; LAMR, late-stage molecular AMR; NR, no rejection; PC1, principal component 1; PC2, principal component 2; PC3, principal component 3; PCA, principal component analysis; TCMR, T cell–mediated rejection; TCMRProb, TCMR-probability classifier.

