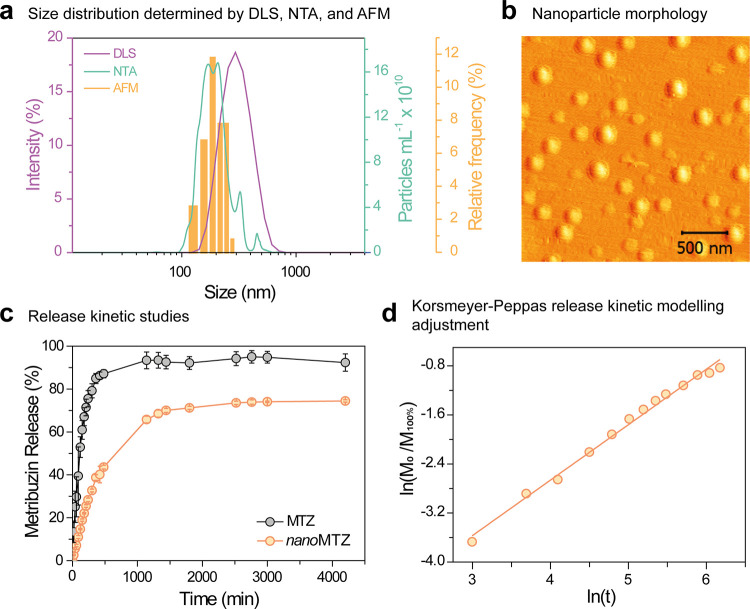
Figure 1.
Size distribution and morphology of nanoMTZ nanoparticles and in vitro release profile of metribuzin. (a) Size distribution by DLS, NTA, and AFM techniques; (b) AFM micrograph of nanoMTZ nanoparticles; (c) in vitro release profile of encapsulated and unencapsulated metribuzin in PCL nanocapsules; and (d) adjustment of nanoMTZ release kinetics to the Korsmeyer–Peppas mathematical model.

