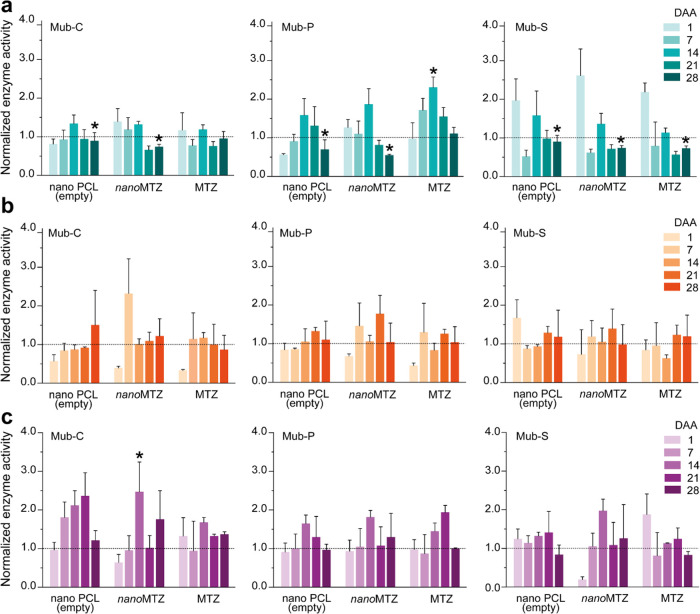
Figure 3.
Enzymatic activity of the clay (a), SL-1 (b), and SL-2 (c) soils, normalized in relation to the control (dashed line, i.e., samples without the addition of nanoparticles and pesticides). Error bars indicate the standard deviation (biological replicates n = 3, technical replicates n = 6). For enzymatic activities, significant differences from the control (Tukeyʼs test, p < 0.01) are indicated by an asterisk (*). DAA = days after application of the treatments.

