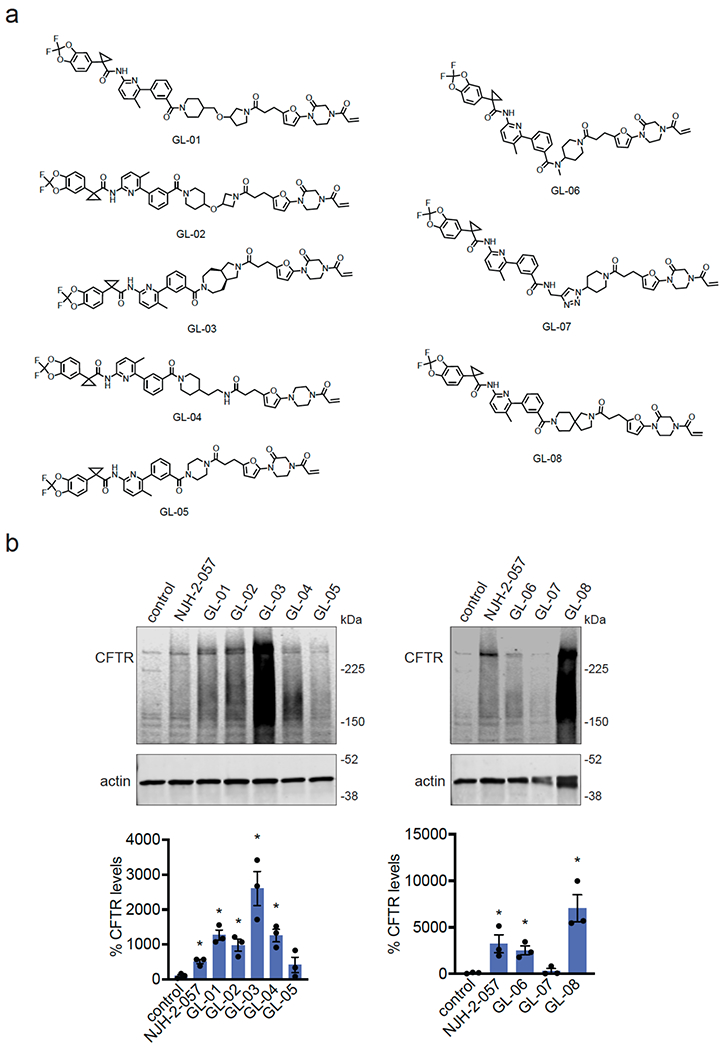
Extended Data Figure 9.

CFBE41o-4.7 cells expressing ΔF508-CFTR were treated with vehicle DMSO or DUBTACs (10 μM) for 24 h and CFTR and loading control actin levels were assessed by Western blotting. Blot is representative of n=3 biologically independent samples/group. Bar graphs show quantification of CFTR levels shown as individual biological replicate data and average ± sem. Statistical significance was calculated with unpaired two-tailed Student’s t-tests compared to vehicle-treated controls and is expressed as *p<0.05.
