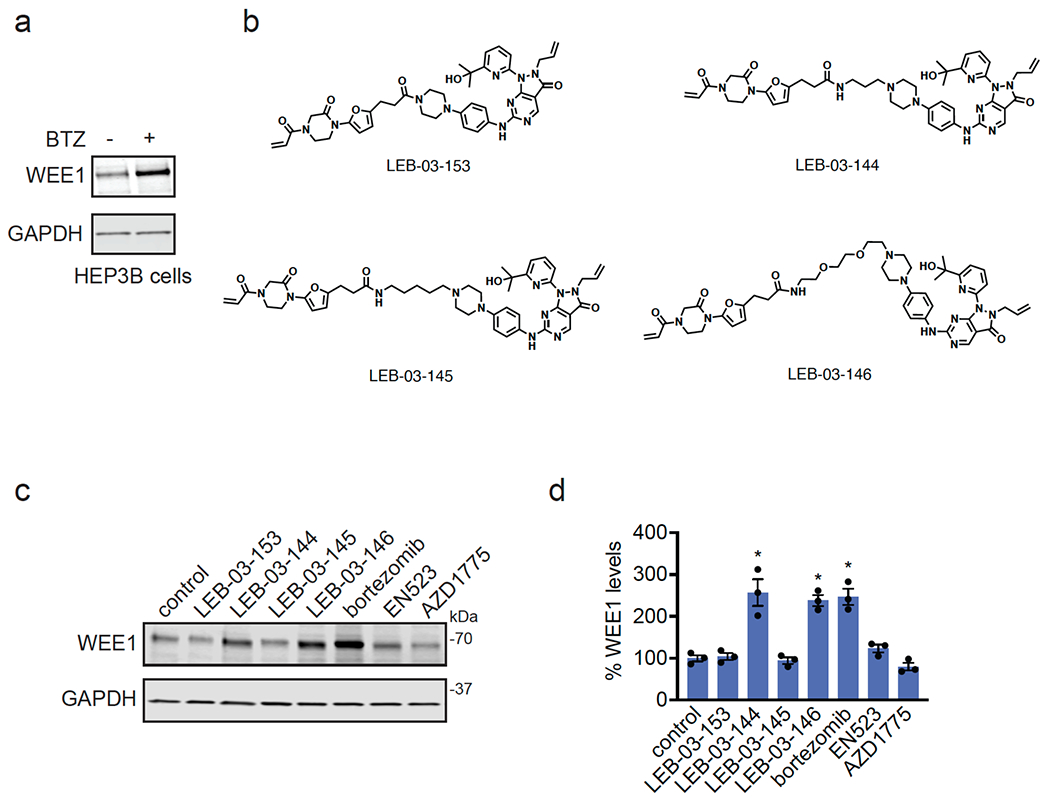
Extended Data Figure 15. WEE1 DUBTAC.

(a) HEP3B cells were treated with DMSO vehicle or bortezomib (1 μM) for 24 h. WEE1 and loading control GAPDH levels were assessed by Western blotting. (b) Structures of four WEE1 DUBTACs linking AZD1775 to the OTUB1 recruiter EN523 through four different linkers. (c) HEP3B cells were treated with DMSO vehicle, the four DUBTACs, bortezomib, EN523, or AZD1775 at 1 μM for 24 h. WEE1 and loading control GAPDH levels were assessed by Western blotting. Blots shown in (a) and (b) are representative blots from n=3 biologically independent samples/group. Data in bar graphs show individual biological replicate values and average ± sem from n=3 biologically independent samples/group.
