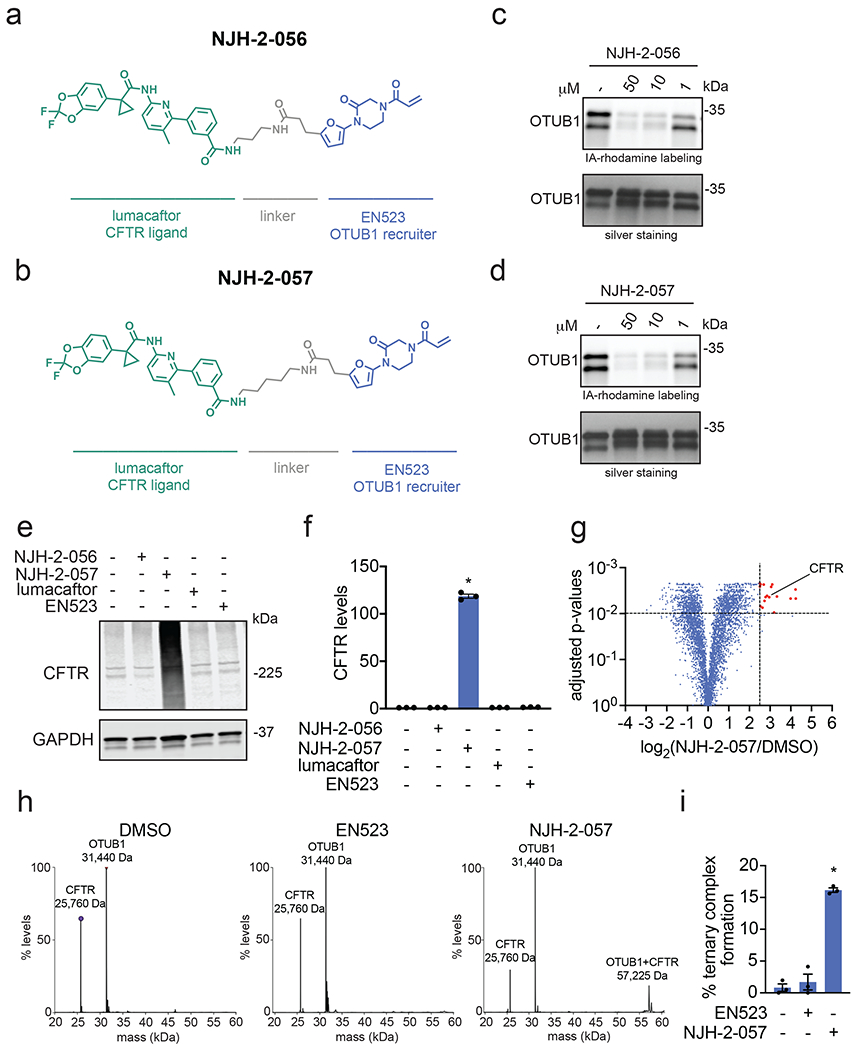
Figure 3. DUBTAC against mutant CFTR.

(a, b) Structures of NJH-2-056 and NJH-2-057; these DUBTACs against mutant CFTR protein are formed by linking CFTR ligand lumacaftor to OTUB1 recruiter EN523 through C3 and C5 alkyl linkers, respectively. (c, d) Gel-based ABPP analysis of NJH-2-056 and NJH-2-057 against OTUB1. Vehicle DMSO or DUBTACs were preincubated with recombinant OTUB1 for 30 min at 37 °C prior to addition of IA-rhodamine (100 nM) for 30 min at room temperature. OTUB1 was run on SDS/PAGE and in-gel fluorescence was assessed. Protein loading was assessed by silver staining. (e) Effect of DUBTACs on mutant CFTR levels. CFBE41o-4.7 cells expressing ΔF508-CFTR were treated with vehicle DMSO, NJH-2-056 (10 μM), NJH-2-057 (10 μM), lumacaftor (10 μM), or EN523 (10 μM) for 24 h, and mutant CFTR and loading control GAPDH levels were assessed by Western blotting. (f) Quantification of the experiment described in (e). (g) TMT-based quantitative proteomic profiling of NJH-2-057 treatment. CFBE41o-4.7 cells expressing ΔF508-CFTR were treated with vehicle DMSO or NJH-2-057 (10 μM) for 24 h. Data shown are from n=3 biologically independent samples/group. Full data for this experiment can be found in Table S3. (h) Native MS analysis of DUBTAC-mediated ternary complex formation. OTUB1 (2 μM) and the CFTR-nucleotide binding domain (2 μM) were incubated with DMSO vehicle, EN523 (50 μM), or NJH-2-057 (50 μM) in 150 mM ammonium acetate with MgCl2 (100 μM) and ATP (100 μM). Representative mass spectra from n=3 biologically independent samples/group are shown. (i) percentage of ternary complex formation assessed by measuring the CFTR-OTUB1 complex formed in the experiment described in (h). Gels shown in (c, d, e) are representative of n=3 biologically independent samples/group. Data in (f, i) show individual biological replicate values and average ± sem from n=3 biologically independent samples/group. Statistical significance was calculated with unpaired two-tailed Student’s t-tests in (f, i) compared to vehicle-treated controls and is expressed as *p<0.05.
