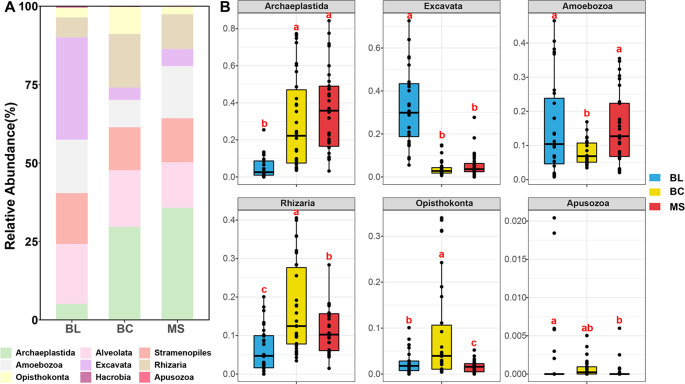
Figure 4.
Relative abundances at the supergroup level: (A) bar graph and (B) box plot. Different letters (a, b, c) indicate significant difference based on a least significant difference (LSD) test (p < 0.05). BL: original tailings from bare land, BC: tailings of biological crusts, and MS: tailings from the Miscanthus sinensis rhizosphere.

