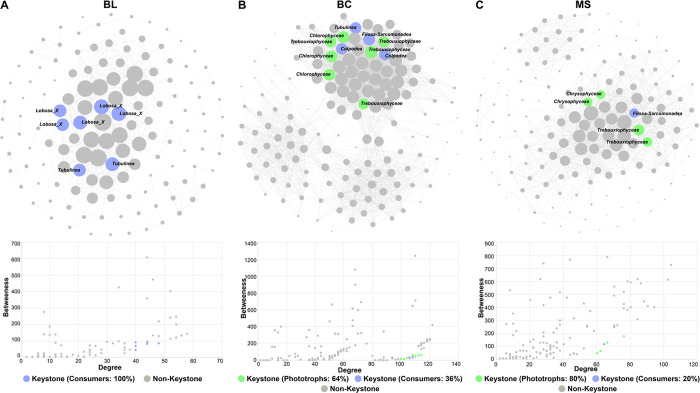
Figure 7.
Co-occurrence network analysis of protist–protist showing the biological interactions in (A) BL, (B) BC, and (C) MS. Edges show significant connections. The size of each node is proportional to the number of connections to it. The scatter plot below the network plot shows criteria used to select the keystone taxa. BL: original tailings from bare land, BC: tailings of biological crusts, and MS: tailings from the Miscanthus sinensis rhizosphere.

