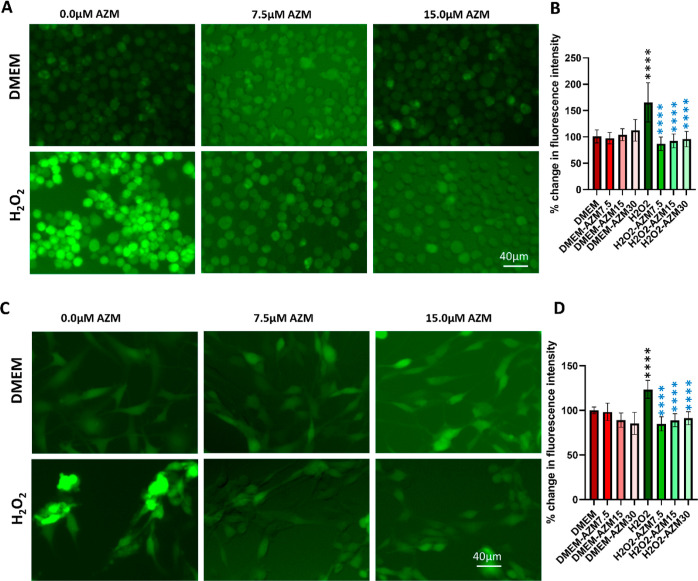
Figure 1.
AZM inhibits H2O2-induced intracellular ROS production in BV-2 microglial and MIO-M1 Müller glial cells in vitro. (A) Representative images of DCFDA staining for BV2 cells, (B) spectrofluorometric measurement of DCFDA biochemical assay for BV2 cells, (C) representative images of DCFDA staining for MIO-M1 cells, (D) spectrofluorometric measurement of DCFDA biochemical assay for MIO-M1 cells. Red bars indicate fluorescence quantified in control cells, faint red bars indicate AZM-treated cells, green bars indicate H2O2-treated cells, and faint green bars indicate AZM-pretreated H2O2-treated cells. DMEM was taken as 100% and it was compared with the rest of the groups. All the results were presented as mean ± SD, n = 6, and one-way ANOVA was performed with Tukey’s multiple comparisons, ****p < 0.0001, black stars are differences as compared to DMEM, and blue stars are differences as compared to the H2O2.

