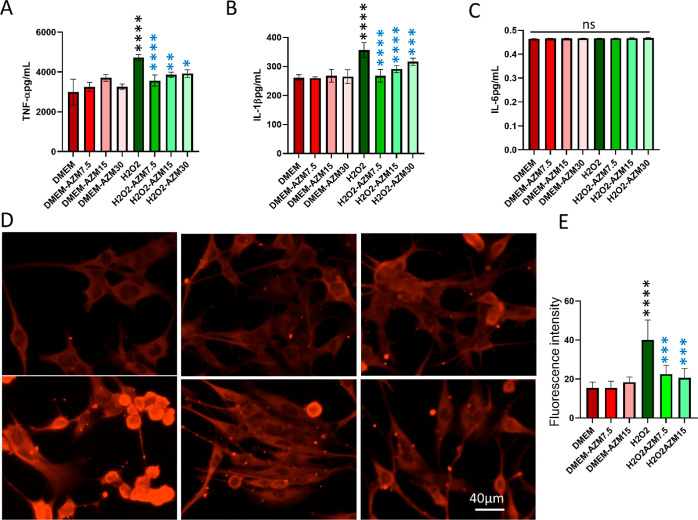
Figure 3.
Confirmation of the anti-inflammatory effect of AZM on BV-2 microglial cells by ELISA. (A) TNF-α, (B) IL-1β, and (C) IL-6 secreted by BV-2 cells. Red bars indicate fluorescence quantification in control cells, faint red bars indicate AZM-treated cells, green bars indicate H2O2-treated cells, and faint green bars indicate AZM-pretreated H2O2-treated cells. (D) Representative images of the anti-GFAP antibody staining in Müller glia. (E) Quantification of fluorescence intensity from GFAP immunostaining images. All the results were presented as mean ± SD, n = 6, and one-way ANOVA was performed with Tukey’s multiple comparison, *p < 0.05, **p < 0.01, ***p < 0.001, ****p < 0.0001, and ns represents p > 0.05, black stars are as compared to DMEM and blue stars are as compared to the H2O2. AZM inhibits oxidative stress-induced cell death in retinal glia.

