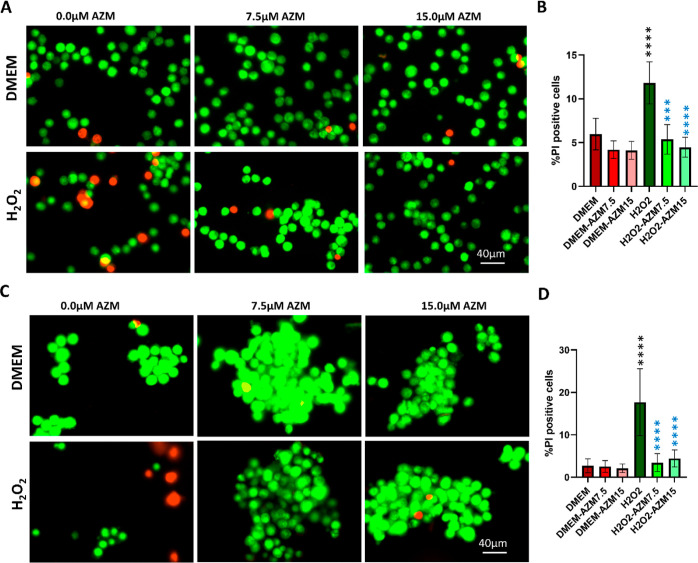
Figure 4.
Visualization of live and dead cells by acridine orange/propidium iodide (AO/PI) staining. AO gives green fluorescence for live cells, and PI gives red fluorescence for necrotic cells and yellow for apoptotic cells. (A) Representative images of AO/PI staining for BV-2 cells, (B) quantification of the percentage PI-positive cells compared to the total number of microglial cells (n = 8), (C) representative images of AO/PI staining for MIO-M1 cells, (D) quantification of the percentage of PI-positive cells compared to the total number of MIO-M1 cells (n = 8). All the results were presented as mean ± SD, and one-way ANOVA was performed with Tukey’s multiple comparisons, **p < 0.01, ***p < 0.001, ****p < 0.0001, black stars as compared to DMEM, and blue stars are as compared to the H2O2.

