Figure 1.
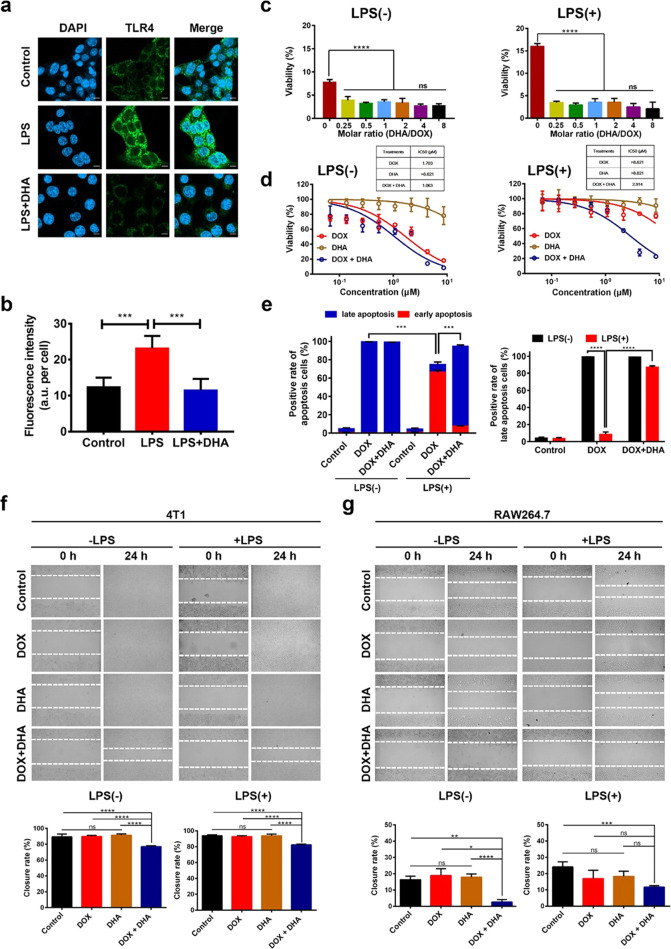
Effect of DHA on TLR4 expression, cytotoxicity, and cell migration in vitro. (a) Representative confocal images of TLR4 expression patterns in murine 4T1 cells after being treated with 10 μM DHA for 24 h followed by 4 μg mL–1 of LPS stimulation. Scale bar = 10 μm. (b) Fluorescence intensity per cell of TLR4 on 4T1 cells is analyzed by ImageJ. (c) At a constant DOX concentration of 1.72 μM, dose–response histograms of 4T1 cells without (left) or with (right) 4 μg mL–1 of LPS prestimulation for 72 h against different molar ratios of DHA and DOX for 72 h. (d) Dose–response curves of 4T1 cells untreated (left) or treated (right) with 4 μg mL–1 of LPS prestimulation for 72 h against DOX, DHA, and DOX + DHA for 72 h. (e) Apoptosis rate (left) and late apoptosis rate (right) of 4T1 cells untreated or treated with 4 μg mL–1 of LPS prestimulation for 72 h against DOX, and DOX + DHA with an equivalent concentration of 5.00 μg mL–1 of DOX and 3.12 μg mL–1 of DHA for 4 h. (f, g) Representative images of 4T1 (left) and RAW264.7 (right) prestimulation with 4 μg mL–1 of LPS for 72 h or not were taken by phase contrast microscope before and after treatment with 1.00 μg mL–1 of DOX or 0.57 μg mL–1 of DHA. Closure rates were obtained by ImageJ software (below). Data represent means ± SD (n = 3). P values were determined by one-way ANOVA with post hoc Tukey test and represented using *P < 0.05, **P < 0.01, ***P < 0.001, and ****P < 0.0001. n.s., not significant.

