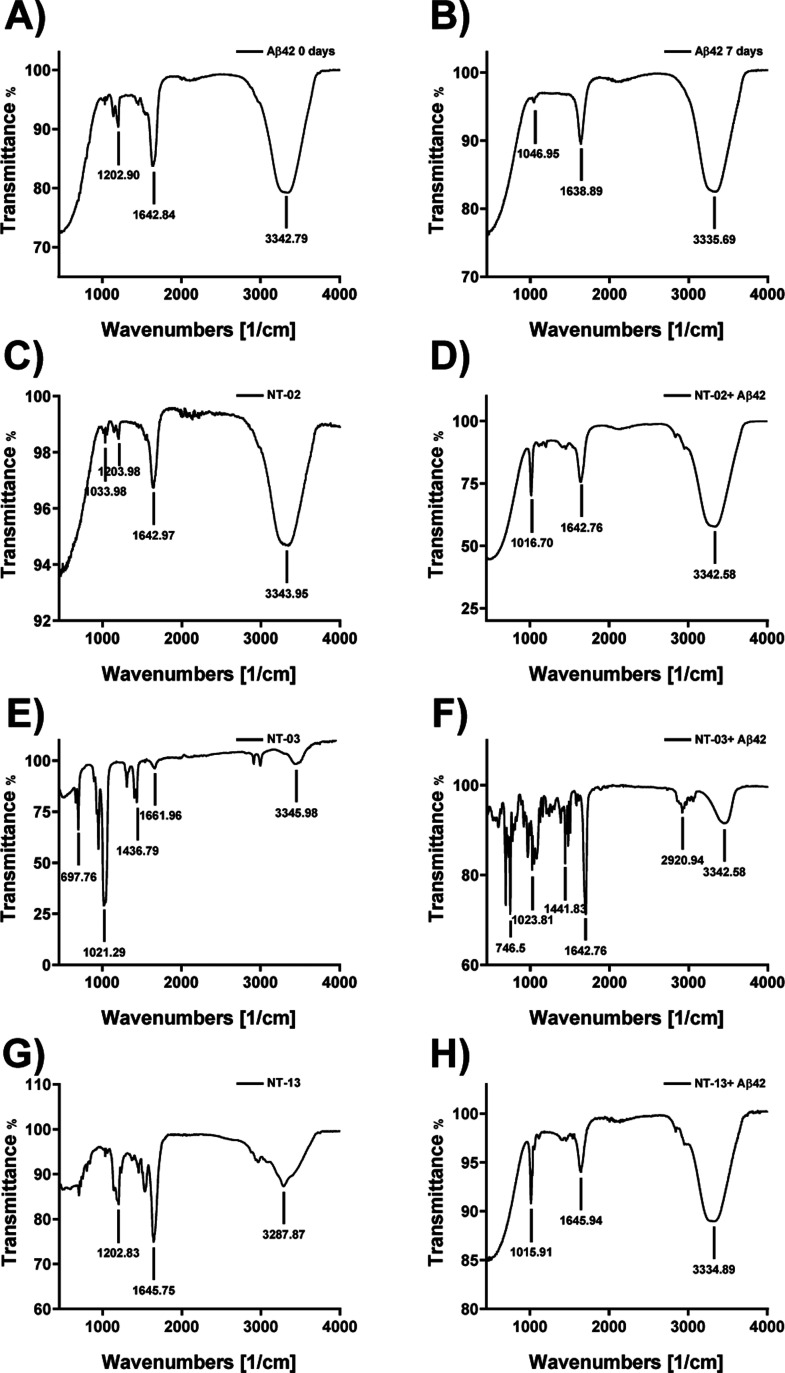
Figure 6.
Analysis of β-sheet content by FTIR spectroscopy. FTIR spectrum of the (A) Aβ42 peptide alone for 0 day incubation. The spectrum shows the Aβ42 peptide in α-helix conformation. (B) Aβ42 peptide alone upon 7 days of incubation. The spectrum shows that the Aβ42 peptide converted into β-sheet conformation. (C,E,G) FTIR spectrum of peptide NT-02, 03, and 13 alone for 7 days of incubation. The spectrum shows that NT peptides in α-helix conformation. (D,F,H) FTIR spectrum of Aβ42 with NT-02, 03, and 13 for 7 days of incubation. The spectrum shows the Aβ42 peptide in α-helix conformation.

