Figure 7.
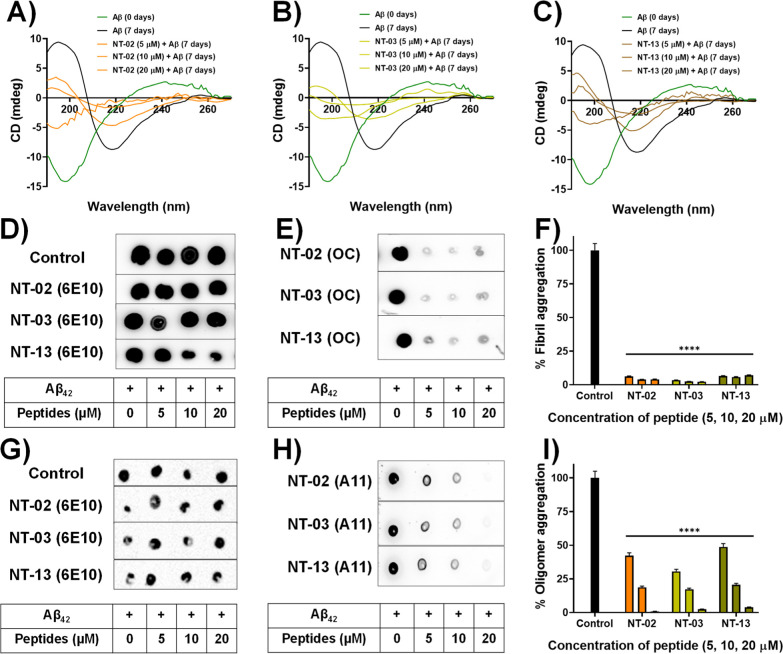
CD spectroscopic studies showing β-sheet content and the inhibitory effects of peptides (A) NT-02, (B) NT-03, and (C) NT-13. CD spectra show the Aβ42 sample at t = 0 h (green), and the Aβ42 sample at t = 7 days (black). Dot blot assay for monitoring Aβ42 aggregation. (D) Dot blot image for Aβ42 content detected by 6E10. (E) Dot blot image for Aβ42 fibrillary aggregation inhibition in the presence of NT peptides detected by OC. (F) Bar diagram of Aβ42 fibrillary aggregation inhibition by NT peptides. (G) Dot blot image for Aβ42 content detected by 6E10. (H) Dot blot image for Aβ42 oligomeric aggregation inhibition in the presence of NT peptides detected by A11. (I) Bar diagram of Aβ42 oligomer inhibition by NT peptides. Error bars represent mean ± standard deviation (SD), n = 3. Statistical data were analyzed by a one-way ANOVA test by the multiple comparison test (*p < 0.05, **p < 0.01, ***p < 0.001, ****p < 0.0001, vs control) using software (GraphPad Prism, ISI, San Diego, CA).

