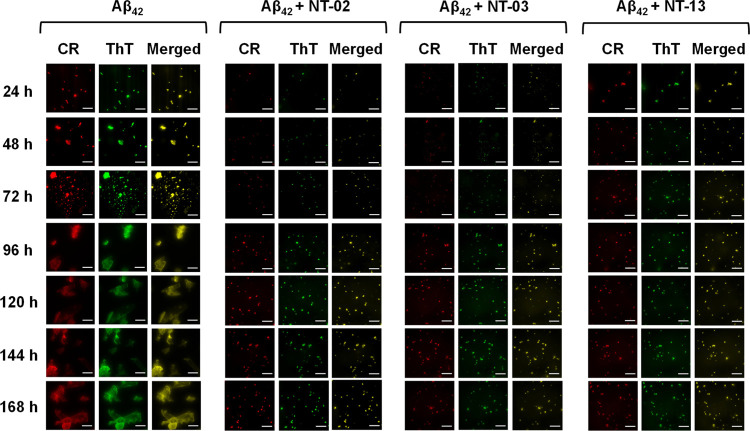
Figure 8.
CR and ThT binding to Aβ42 aggregates. Fluorescence microscopical images show the presence of Aβ42 aggregates in all samples. Fluorescence microscopic images of 10 μM Aβ42 peptide in the presence of 1 μM CR (column 1) and ThT (column 2). Images clearly indicate that NT peptides inhibit the formation of Aβ42 aggregates. The scale bar corresponds to 200 μm.

