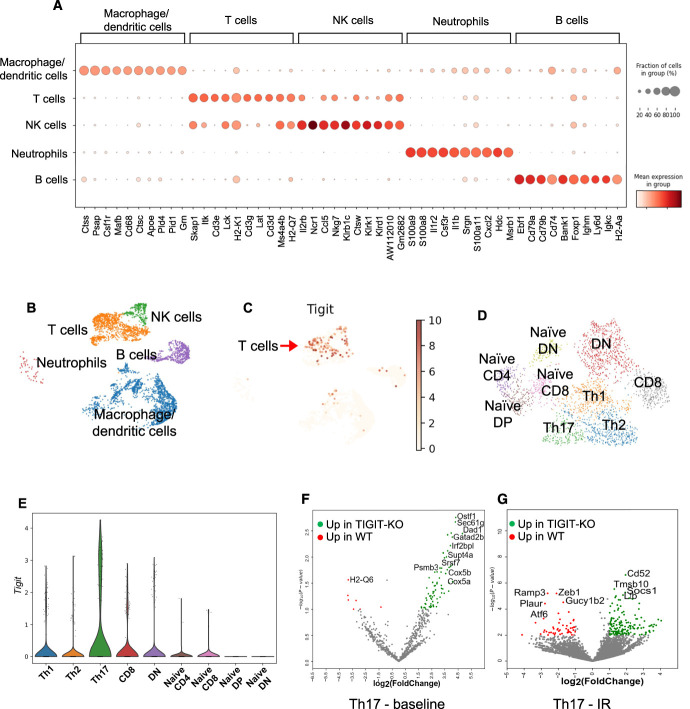
Figure 6.
scRNA-Seq analysis of flow-sorted kidney CD45+ cells showing distinct inflammatory and metabolic differences between WT and TIGIT-KO kidney T cells at baseline and 24 hours post-IR injury. (A) Dot plot showing expression of marker genes used for annotating different immune cell clusters. (B) UMAP showing major immune cell populations identified in WT control kidneys. (C) UMAP showing Tigit expression primarily restricted to T/NK cell cluster among all kidney immune cells in WT control mice. (D) UMAP showing annotated T cell populations in WT and TIGIT-KO mice. (E) Violin plot representing Tigit expression in different T cell subsets with Th17 cells as major expressers, 24 hours post-IR in WT mice. (F and G) Volcano plots showing top differentially expressed genes (DEGs) in Th17 cells at baseline and 24 hours after IR injury between WT and TIGIT-KO mice. TIGIT-KO, TIGIT knockout.

