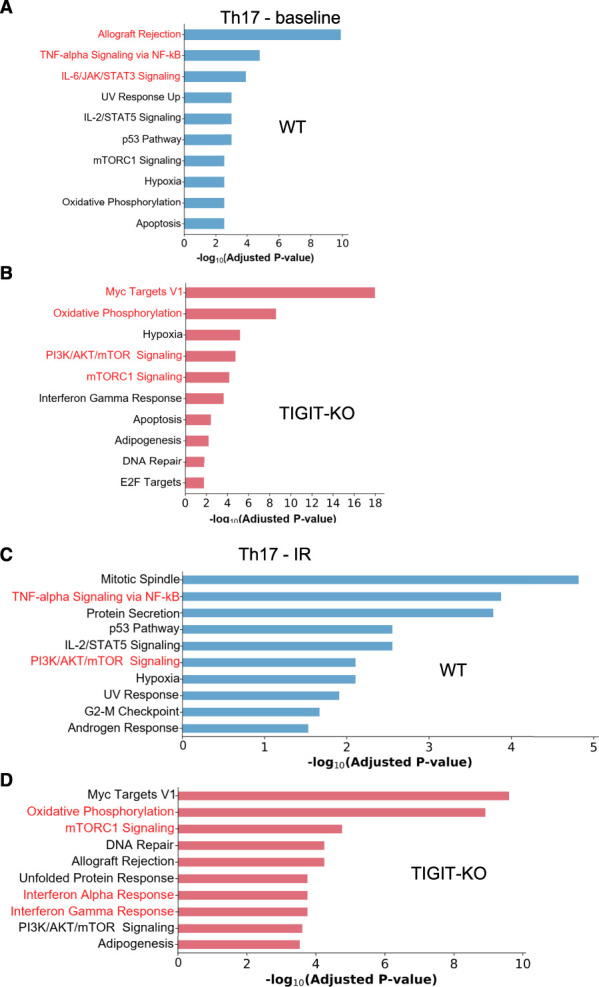
Figure 7.

Gene set enrichment analysis (GSEA) of differentially expressed genes (DEGs) in Th17 cells from WT and TIGIT-KO kidneys at baseline and 24 hours post-IR injury. (A and B) GSEA plots representing cellular responses/pathways in WT (blue) and TIGIT-KO (red) Th17 cells at baseline. (C and D) GSEA plots of WT (blue) and TIGIT-KO (red) Th17 cells 24 hours after IR injury. mTOR, mammalian target of rapamycin.
