
Figure 8.
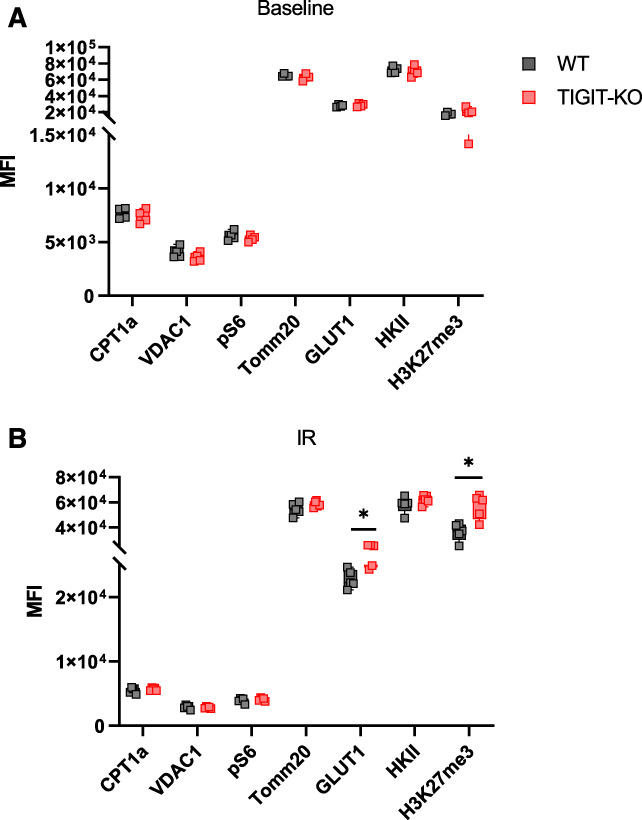
Metabolic assessment of kidney T cells in WT and TIGIT-KO mice at baseline and 24 hours post-IR injury. (A) Graph showing MFI values of the metabolism-related proteins CPT1a, VDAC1, pS6, TOMM20, GLUT1, HKII, and H3K27me3 in CD4+ T cells from WT and TIGIT-KO kidneys at baseline and (B) 24 hours after IR injury. Data between groups were analyzed using the unpaired nonparametric Mann-Whitney test. Graphs represent median (IQR) values. *P≤0.05. TIGIT-KO, TIGIT knockout; VDAC1, voltage-dependent anion channel 1.