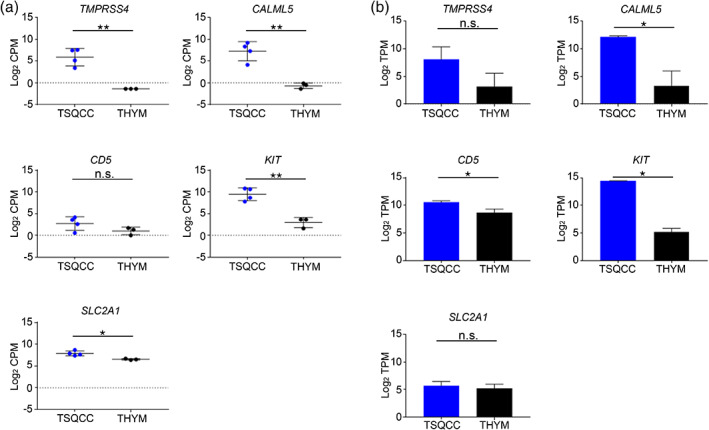
FIGURE 2.

Promoter activity and mRNA expression levels of novel candidates and known markers. (a) The promoter activities of two novel candidates and three known markers for thymic squamous cell carcinoma in scatter plots with cap analysis of gene expression (CAGE) data. (b) The mRNA expression levels of novel candidates and known markers for thymic squamous cell carcinoma with the Cancer Genome Atlas (TCGA) data are shown as bar graphs (mean with standard error of the mean). CAGE, cap analysis of gene expression; CPM, count per million; THYM, type B3 thymoma; TPM, transcripts per million; TSQCC, thymic squamous cell carcinoma. *p < 0.05, **p < 0.005.
