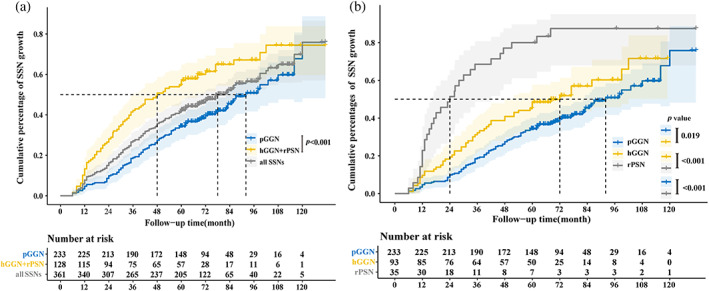
FIGURE 4.

The Kaplan–Meier plot for time to subsolid nodules (SSNs) growth. Curves with different colors represent the cumulative growth percentage of pure ground‐glass nodules (pGGNs), heterogeneous ground‐glass nodules (hGGNs), and real part‐ solid nodules (rPSNs), respectively. (a) All enrolled SSNs (the pGGN group vs. the hGGN + rPSN group). There was a significant difference in the cumulative percentage of SSN growth between the pGGN group and the hGGN + rPSN group (p < 0.001). (b) All enrolled SSNs (the pGGN group vs. the hGGN group vs. the rPSN group). There was a significant difference in the cumulative percentage of SSN growth among the pGGN, hGGN, and PSN groups.
