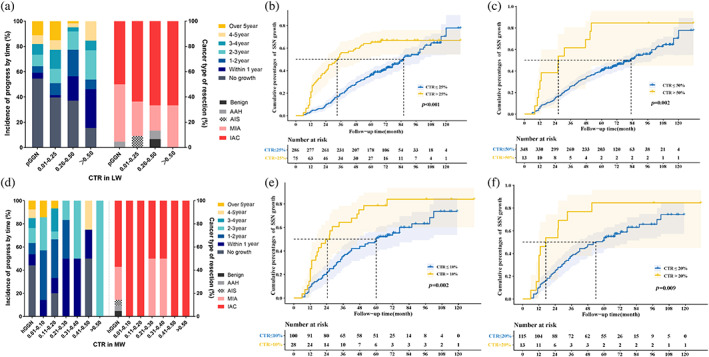
FIGURE 6.

The associations between the consolidation tumor ratio (CTR) at the initial CT examination and the time interval until detection of subsolid nodule growth and the histologic subtype. (a) Incidence of progress by time and cancer type of resection in different lung window‐CTR (LW‐CTR) groups. (b) The LW‐CTR >25% group shows a significantly higher cumulative growth percentage than the ≤25% group (p < 0.001). (c) The LW‐CTR >50% group shows a significantly higher cumulative growth percentages than the ≤50% group (p = 0.002). (d) Incidence of progress by time and cancer type of resection in different mediastinum window‐CTR (MW‐CTR) groups. (e) The MW‐CTR >10% group shows a significantly higher cumulative growth percentage than the ≤10% group (p = 0.002). (f) The MW‐CTR >20% group exhibits a considerably higher cumulative growth percentage than the ≤20% group (p = 0.009).
