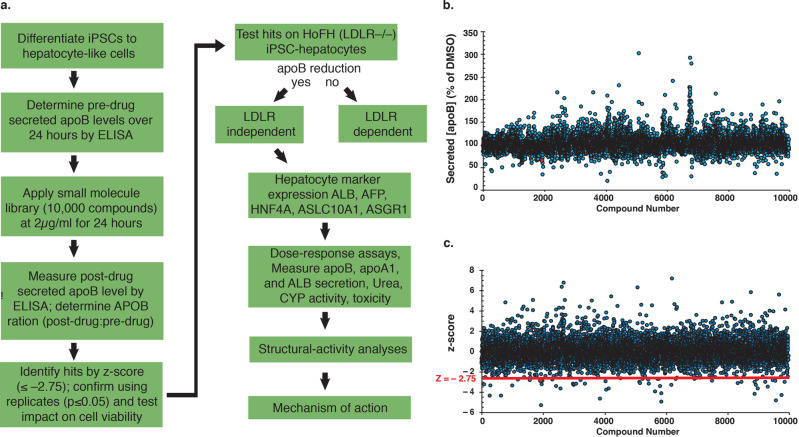
Fig. 1. A small molecule screen using human iPSC-derived hepatocytes.
a Schematic overview of the procedure used to identify compounds that reduce apoB produced by human iPSC-hepatocytes. b Graph showing post-drug: pre-drug ratios (∆ [apoB]) in the medium of apoB in compound-treated compared to DMSO-treated iPSC-hepatocytes (% DMSO). The blue dots represent each individual compound from the SC3 library 10 K representative set. c Graph showing the z score of each individual compound (blue dots) on the post-drug: pre-drug apoB ratio. Red dot is DL-1. Red line indicates the z-score at a value of –2.75 (z = –2.75).

