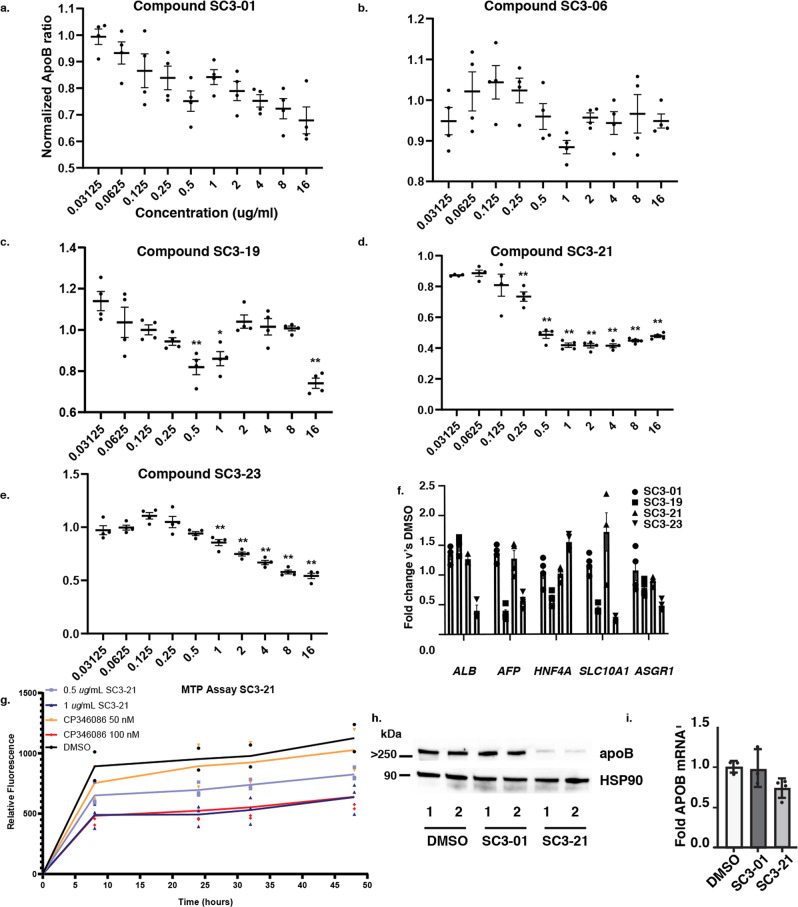
Fig. 3. Characterization of compounds identified in primary screen.
a–e Human iPSC-hepatocytes were treated with compounds SC3-01, -06, -19, -21, and -23 from 0.03125 to 16 µg/ml for 24 h. Culture medium from pre-drug and post-drug treatment were collected for human-specific apoB ELISA. Post-drug apoB: pre-drug apoB ratio from each treatment was determined and compared to DMSO-treated cells. All data are shown as mean ± SD of three replicates (n = 3). f Human iPSC-hepatocytes were treated with 2 µg/ml of compound SC3-01, -19, -21, and -23 for 24 h. Bar graph shows ALB, AFP, HNF4α, SLC10A1, and ASGR1 mRNA levels that were determined by real-time qPCR. Fold change was calculated and normalized with vehicle only (n = 3). Data are shown as mean ± SD. All statistical analysis was performed using Student’s t test or one-way ANOVA followed by Dunnett’s test as appropriate; *p ≤ 0.05, **p ≤ 0.01. g Graph showing the impact on in vitro MTP activity of DL-21 (0.5 and 1.0 µg/ml) and the known MTP inhibitor CP346086 (50 and 100 nM) compared to vehicle (DMSO). h Immunoblots showing the steady-state level of apoB protein in human iPSC-hepatocytes treated with vehicle (DMSO) or 2 µg/ml SC3-01 or the MTP inhibitor SC3-21. HSP90 levels were used as a loading control. i Human iPSC-hepatocytes were treated with 2 µg/ml of SC3-01, SC3-21, or vehicle (DMSO) for 24 h. Bar graph shows normalized steady-state APOB mRNA levels determined by real-time qPCR (n = 4).

