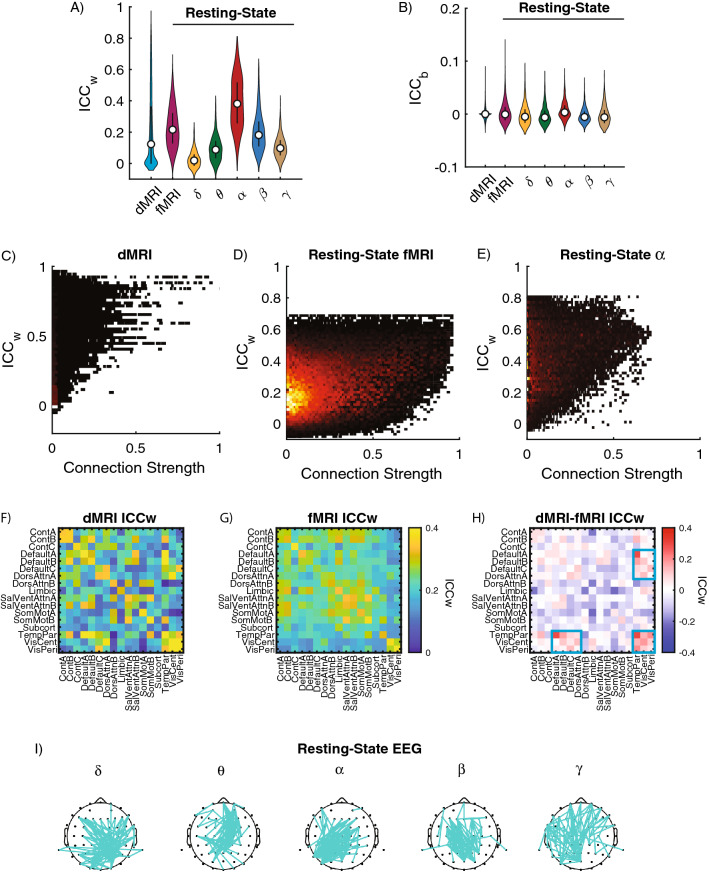
Figure 1.
Reliability of individual connections. (A) Distribution of ICCw and (B) ICCb for dMRI and resting-state fMRI and EEG frequency bands. For each violin plot, the central dot indicates the median, and the line indicates the 25th–75th percentiles. (C–E) Distribution plots showing the connection strength of ICCw scores for (C) dMRI; (D) Resting-State fMRI and (E) EEG-α. (F–H) Average reliability of connection within and between cognitive systems for (F) dMRI and (G) resting-state fMRI. (H) Differences in average ICCw scores across cognitive systems between dMRI minus the fMRI. Blue boxes highlight connections between cognitive systems in which reliability was stronger in dMRI. (I) Connections with ICCw scores in top 5% for δ, θ, α, β and γ frequency bands plotted on the scalp for resting-state EEG. Cognitive systems are defined as Cont: Control A/B/C, Default: Default Mode A/B/C, DorsAttn: Dorsal Attention A/B, Limbic, SalVentAtt: Salience/Ventral Attention A/B, SomMot: Somatomotor A/B, Subcortical, TempPar: Temporal Parietal, VisCent: Visual Central, VisPer: Visual Peripheral.

