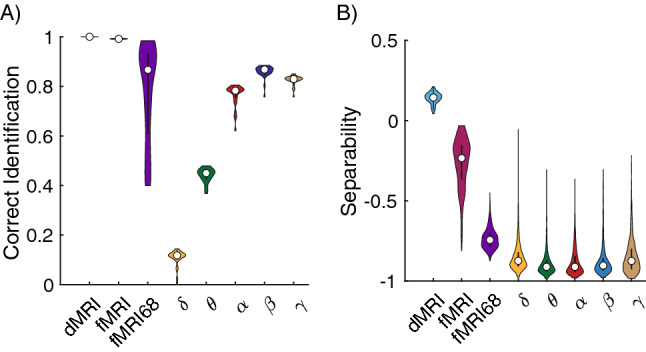
Figure 7.

Fingerprinting performance across imaging modalities. (A) Proportion of networks that were correctly matched to the corresponding individual for dMRI, fMRI, and EEG derived brain networks. (B) Separability of each network in being matched to corresponding individual. fMRI indicates results using the Schafer 200 atlas whereas fMRI68 indicates results using the 68 regions Desikan-Killiany atlas. For each violin plot, the central dot indicates the median, and the line indicates the 25th–75th percentiles.
