
Fig. 4.
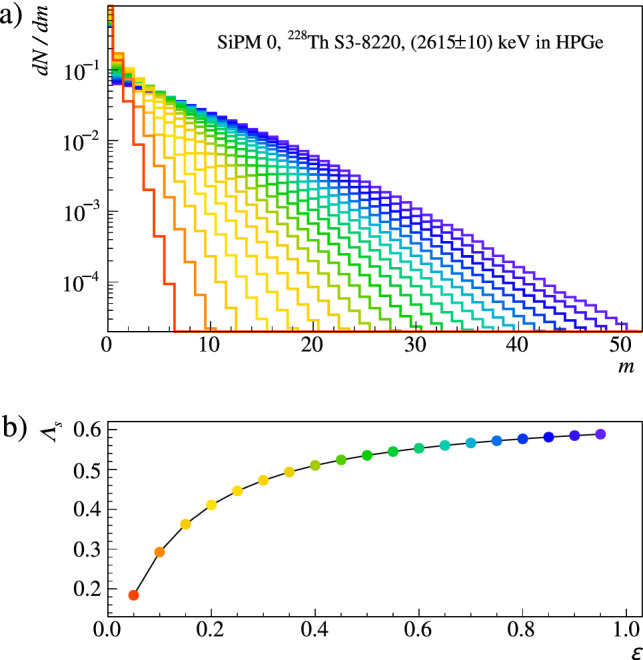
Binomial repopulation. a The pmf defined in Eq. 4 can be obtained for any value of the detection efficiency from the unaltered simulation output. The example shows the pmf for a specific SiPM channel as obtained for Th decays in a calibration source at the top of the array (see also Tab. 1) depositing 2615 ± 10 keV in the HPGe detectors. The result is plotted for a selection of efficiency values, reported in the bottom panel. b The panel shows the non-linear dependence of the light detection probability (defined in Eq. 5). The color coding relates data points with corresponding distributions in the top panel