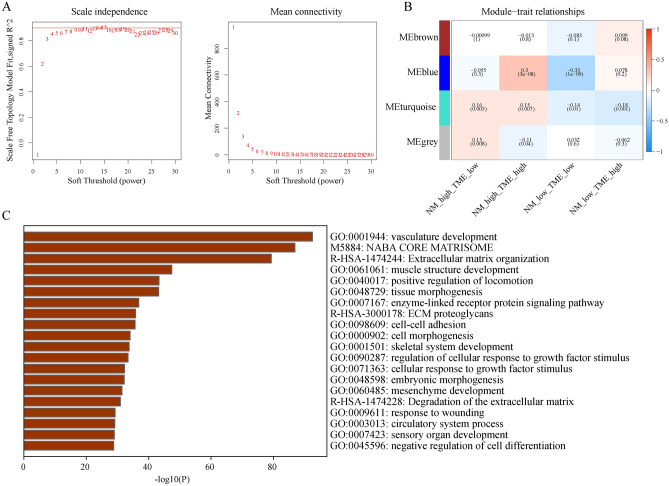
Figure 5.
Exploring key module eigengenes associated with the NMlow/TMEhigh and NMlow/TMElow groups using weighted gene co-expression network analysis. (A) Evaluation of the scale-free fit index for differing soft-thresholding powers (β) and examination of the connectivity of various soft-thresholding powers. (B) A heatmap depicts the association between module eigengenes and various subgroups. (C) Functional enrichment analysis of key module eigengenes. NM nucleotide metabolism, TME tumour microenvironment.

