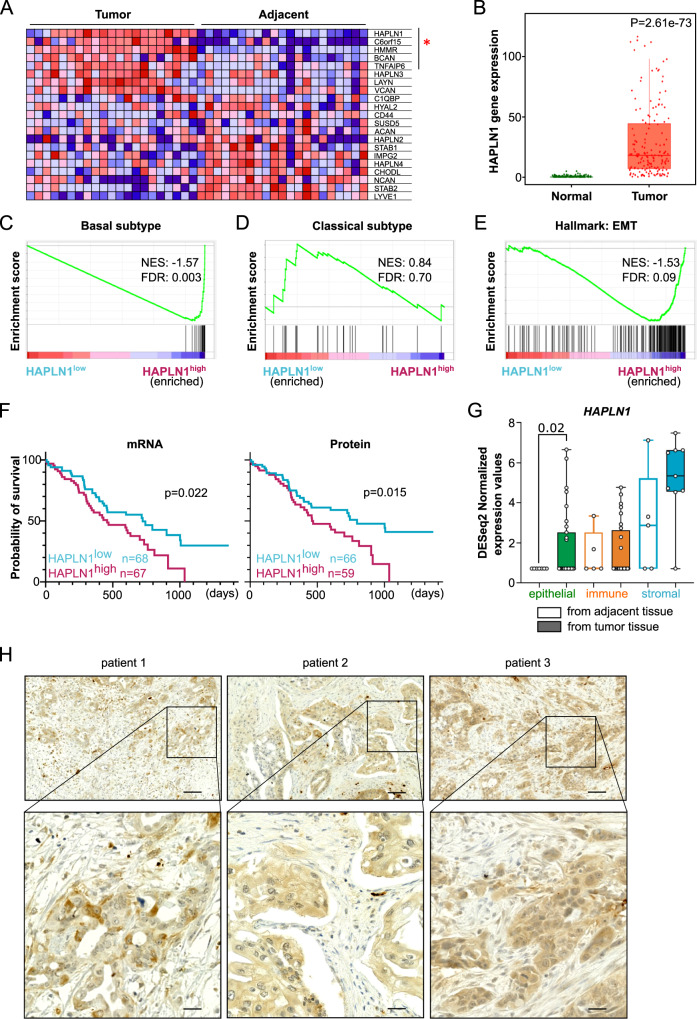
Fig. 1. HAPLN1 is upregulated in PDAC tissue and associated with worse disease outcome.
A GSEA of data set published in Cao et al.23 (matched tumor and adjacent tissue samples. n = 21) on “Gene ontology for Hyaluronic Acid binding”. Leading edge genes significantly deregulated are marked with red star. B HAPLN1 expression levels in normal adjacent or PDAC tumor tissue according to TNMplot, (Normal: Min = 0, Q1 = 0, Med = 0, Q3 = 0, Max = 5, Upper Whisker = 0, n = 252; Tumor: Min = 0, Q1 = 7, Med = 19, Q3 = 57, Max = 1960, Upper Whisker = 129, n = 177). Unpaired non-parametric Mann–Whitney two-tailed U test was applied. C–E GSEA on data set of Cao et al. (2021). Before analysis PDAC patients were divided in HAPLN1 high/low according to mean HAPLN1 expression. Gene sets of “Basal subtype” (C), “Classical subtype” (D) or “Hallmark of Epithelial-to-Mesenchymal transition” (E). n = 140. F Overall survival (OS) of PDAC patients stratified in two cohorts according to their mean HAPLN1 mRNA (n = 135) or protein expression levels (n = 125). For OS log-rank (Mantel–Cox) test was applied. G Human PDAC and adjacent tissue samples were sorted for epithelial/tumoral cells (EpCAM+ CD45−), immune cells (EpCAM− CD45+) and stromal cells (EpCAM− CD45−). HAPLN1 expression in cell types isolated from tumor by RNAseq; expression normalized to control tissue. Epithelial: Normal, Min = 0,7140, Q1 = 0,7140, Med = 0,7140, Q3 = 0,7140, Max = 0,7140, Upper Whisker = 0, n = 7; Tumor, Min = 0,7140, Q1 = 0,7140, Med = 0,7140, Q3 = 2,520, Max = 6,651, Upper Whisker = 1,746, n = 31. Immune: Normal, Min = 0,7140, Q1 = 0,7140, Med = 0,7140, Q3 = 2,511, Max = 3,343, Upper Whisker = 1,147, n = 5, Tumor, Min = 0,7140, Q1 = 0,7140, Med = 0,7140, Q3 = 2,623, Max = 4,765, Upper Whisker = 1,363, n = 26; Stromal: Normal, Min = 0,7140, Q1 = 0,7140, Med = 2,868, Q3 = 5,211, Max = 7,117, Upper Whisker = 2,622 n = 5; Tumor, Min = 0,7140, Q1 = 4,567, Med = 5,332, Q3 = 6,618, Max = 7,474, Upper Whisker = 2,001, n = 9. Dots represent biological replicates. Unpaired non-parametric Mann–Whitney two-tailed U test was applied. H HAPLN1 protein staining in human PDAC patient samples (n = 20) show staining in areas with tumoral cells. Three examples shown. Scale bar: 100 µm, zoom 25 µm.

